Statistics (for scatter charts)
Use this option to see different statistics according to the available
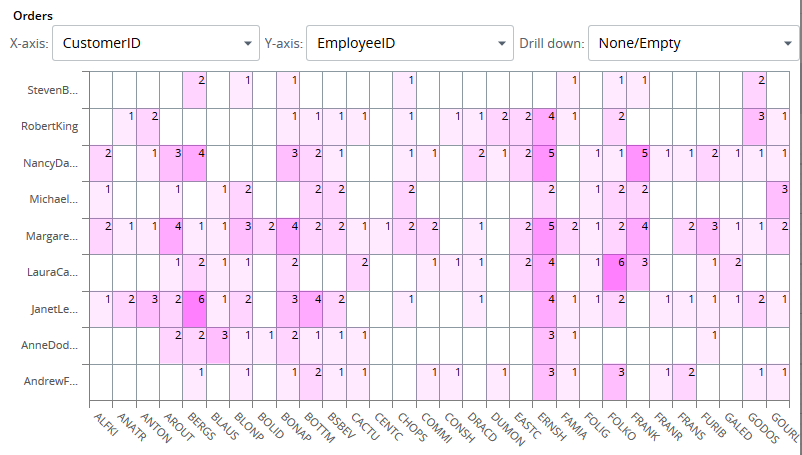
data. For example, if both the axes are categorized data, you can select to see
counts or colored cells.
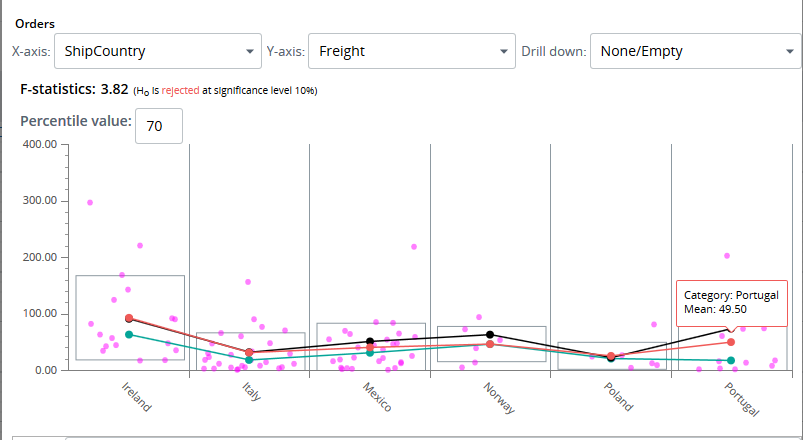
And if only one axis (X-axis) contains categories while the other (Y-axis) has values, then you can select to see such statistical values as mean, median, standard deviations, percentile (for the selected percent level), and also the F-statistics with the result for the defined significance level.