Time
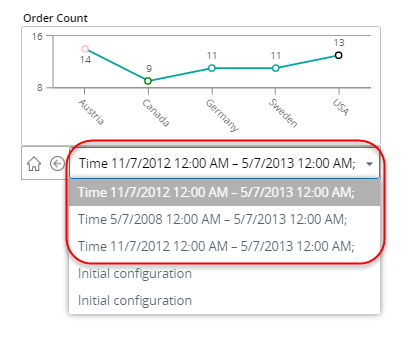
You can change the time interval of the component in the Viewer to a predefined interval (1D, 10D, 1M, 3M, 6M, and more). For example, if you select 1Y, your chart shows data for the period of one year before the last date of initial component settings: it may be current date, last date of metric or fixed date (only if such data exists). The history of your time zooming is stored in a drop-down list and you can return to it any time.
If the chart is broken by time (days, weeks, months, quarters) then after zooming by time breakdown probably will be changed to compatible with new time interval. For example if chart was broken by days and you select 1Y, then chart breakdown will be changed to quarters.
