Use an Aggregation driver
An Aggregation Driver works like a filter for a component and allows filtering by many different measurements, or aggregations, all within the same component. Aggregation driver works only with auto-metrics on metric grids. Auto-metrics are metrics that do not need to be created; they can be calculated automatically on the record.
For example, a metric grid contains a field with passport number and a field with debts. The aggregated field (SUM) shows how much a passport holder has in debts by months (the drill down is set to "months"). Using an aggregation driver, you can change the aggregation directly from the Viewer and see for example, average debts (AVG) by months.
- On the Component toolbar, click the Aggregation driver icon and drag it to the dashboard.
-
On the
Data tab, click
Click here to add new
data to create a new row.
Repeat this step for each aggregation you wish to use.
- Click the aggregation in each row to open a drop-down menu to change the aggregation type. Click OK.
- On the Display subtab, select preferences for displaying the menu on the component.
- On the Styles subtab, select the menu styles, and click OK.
-
Click the
Action tab.
-
Set preferences for the outgoing action and click
OK.
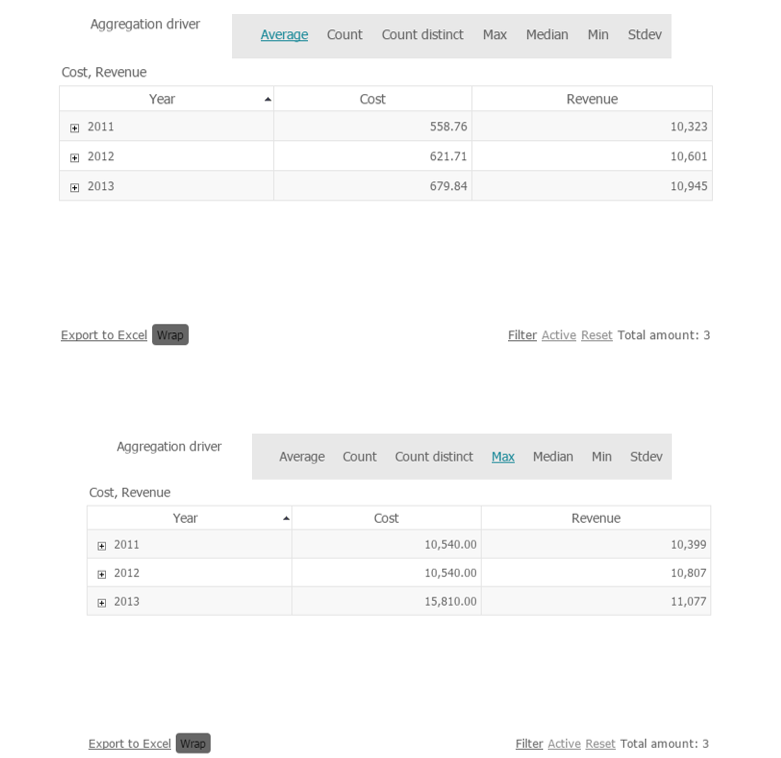
View the final result for the aggregation driver menu. The following example shows an aggregation driver in the form of a menu for the grid.
-
Set preferences for the outgoing action and click
OK.