Kofax Insight Viewer
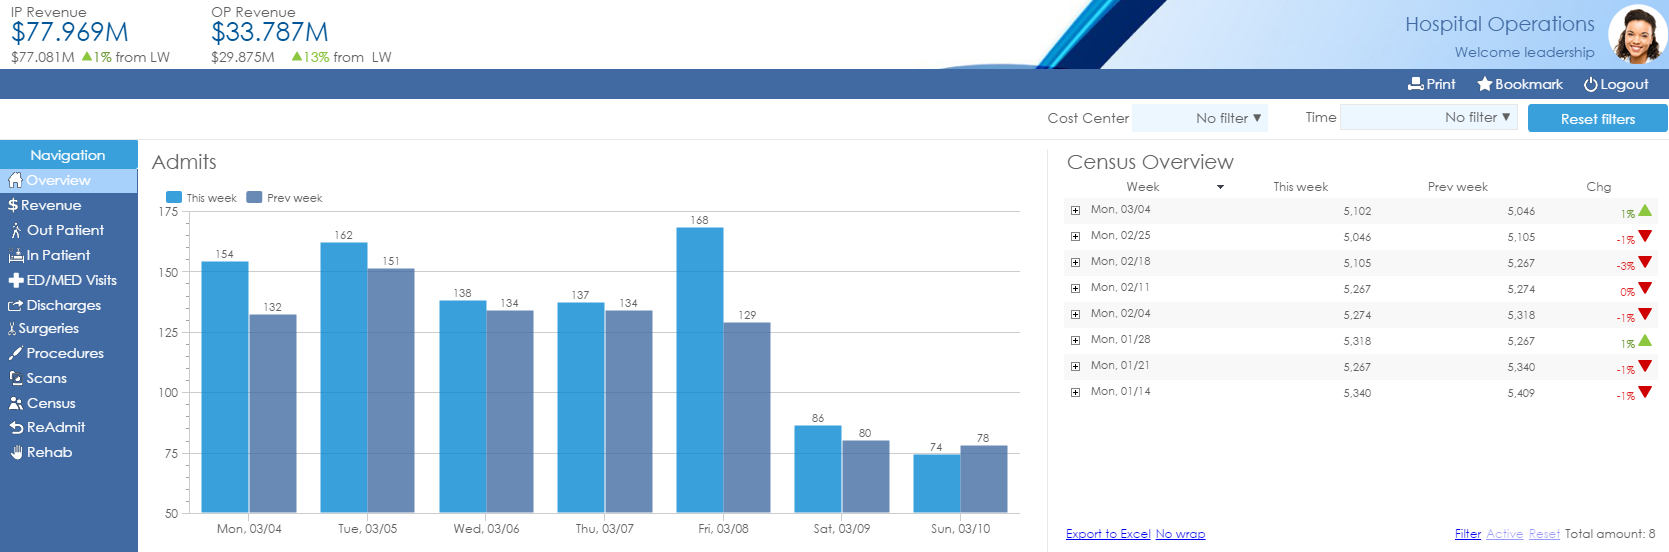
The Viewer is a web-based application that shows the end user different Views that the dashboard designer has created. When you launch the Viewer, it is opened to the default View with one or several components (charts, grids, buttons and more).
Typically, you can transform your charts and grids if that possibility is designed:
- Switch your grid to a bar chart, and then to another chart (for example, a pie chart) or vice-versa.
- Switch a graphical chart into a grid, showing rows and columns of numbers.
- Change to a record grid, showing the individual records and make up the aggregated metric values.
- Plot the record data in a scatter chart to visualize patterns in the data.
- Switch to a pivot table to summarize and analyze data by quickly changing the order of dimensions.