Sub-aggregations
You can apply sub-aggregations to your data to see some aggregated functions based on the selected data series or applied to the whole component. In the later case, sub-aggregations are calculated for each data series in the component, plus for those data series where sub-aggregations are manually added. Possible aggregated functions include:
-
Average
-
Count
-
Max
-
Min
-
Spread
-
StdDev - Standard Deviation
-
Sum
You can also use the All check box.
For the grid, the results of these aggregations are shown in the grid with one or more drill down levels on the level with the smallest drill down number. It means if the grid has no drill down levels, sub-aggregations are not shown.
Follow the procedure below to add sub-aggregations to the grid.
- In Studio, create a metric grid. Open the and verify you have at least one dimension selected for the drill down.
-
On the
Property Panel,
navigate to the
Aggregation mode setting
and click the ellipsis icon to open the list of available options.
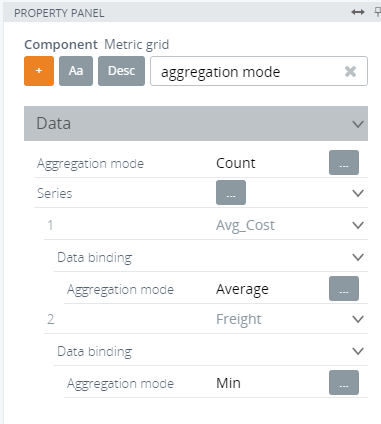
Select items window appears. Select all the options that apply or select the All check box, and click OK.
Note In the sample screen shot, we selected "Count" for the whole grid, "Average" for the first data series (Avg_Cost), and "Min" for the second data series (Freight). -
Save
 the changes and open the grid in the Preview/Viewer.
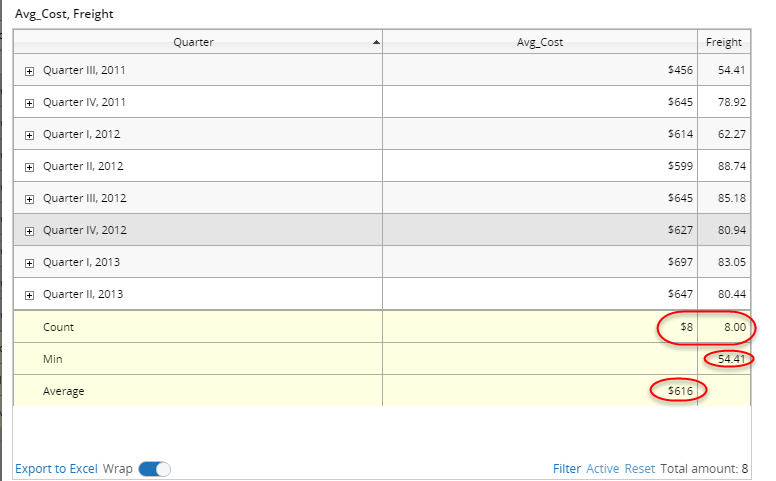
The selected sub-aggregation values are calculated and shown in the grid. In our example, "Count" is shown for the whole component (for both data series), "Min" is shown for the second data series (Freight), and "Average" is shown for first data series (Avg_Cost).
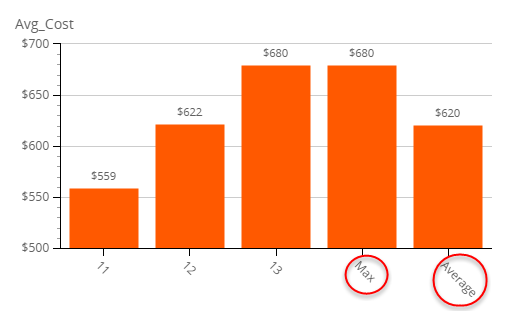
For charts, use the same procedure as described above for grids.