Conditional coloring of transitions
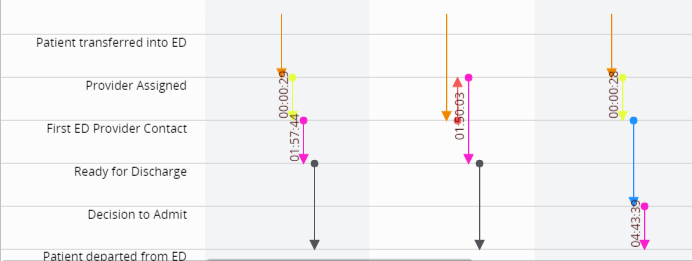
In swimlane charts, you can apply different colors to indicate different transitions based on duration according to the defined time metric.
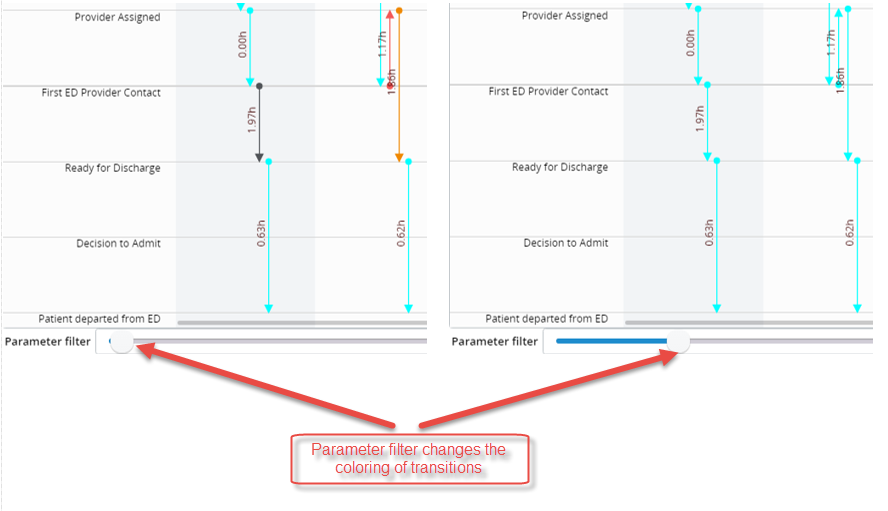
You can define the range for this coloring and configure the color palette. Also, another option for coloring transitions is to add a parameter filter to the swimlane chart so that the dashboard user may adjust the ranges himself.
- In Studio, open the required View and highlight the swimlane component. Open the Display wizard.
-
Navigate to the
Transition coloring tab.
- Select the Coloring time type from the drop-down list. This is the time metric based on which transitions will be colored.
- Select the Coloring measure from the drop-down list. This measure is used in the time metric.
- Define coloring conditions. Click the Add New Data link and fill the tabs as required. You may compare the value either with the direct value or with the parameter. In this case the dashboard user is able to change the parameter through the parameter driver.
-
Click
OK to apply the changes.
Note If more than one condition satisfies the metric, the first condition applies.
See below for changing the coloring in the Viewer.