Swimlane chart
A Swimlane chart is a view (dashboard) component that shows a grouping of all the instances in the process by the path that was taken.
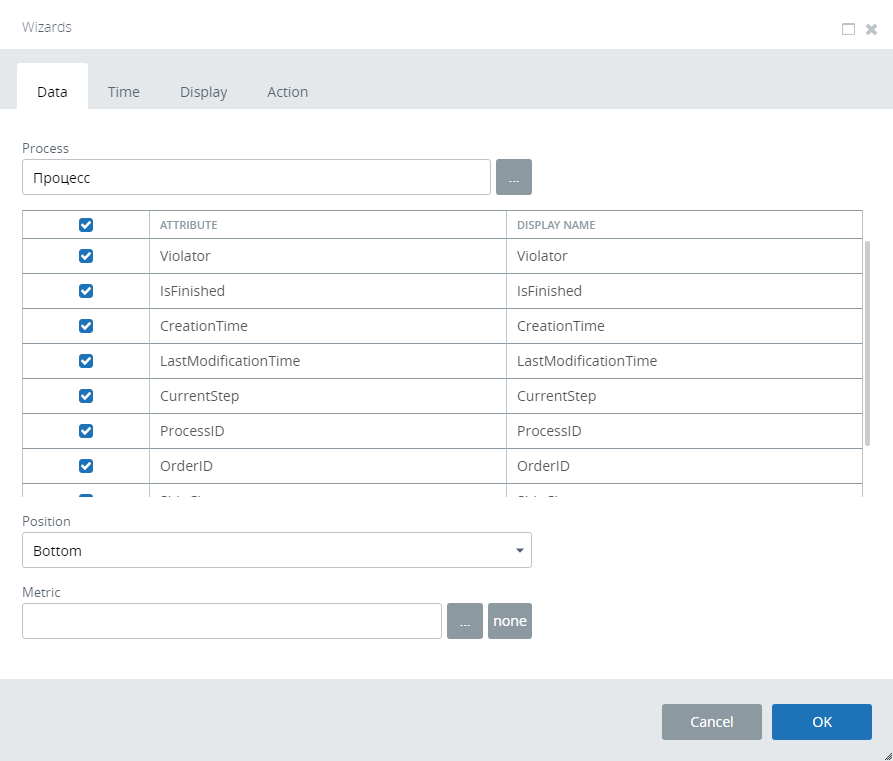
Configure data properties for a Swimlane chart by selecting which process to chart, which properties to include, and the position for the display of process instance data in a process grid. You can hide the process instance details, or show them on the chart or in a pop-up window.
The Time and Action properties are set similarly to other dashboard components.
The Swimlane chart shows the actual process paths that are followed. At the top of each swimlane, a number shows how many process instances follow each path and the percentage of the total represented by each group.
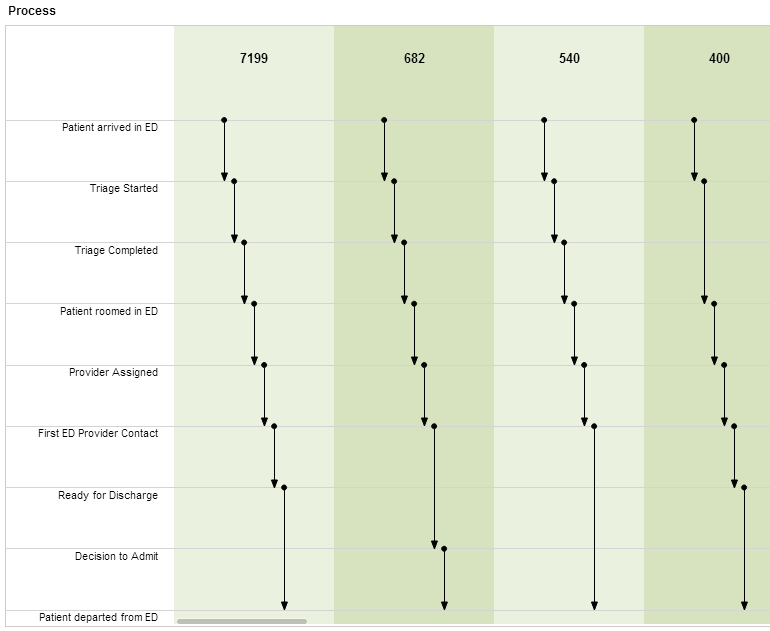
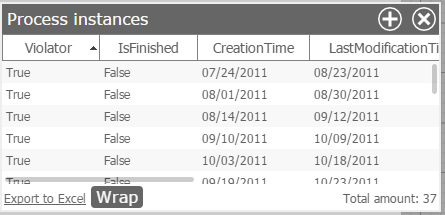
When in Preview or Viewer mode, click the count number at the top of a column to open a window that displays the details for the process instances that followed the selected path.
Click the Data icon on the right of the selected component.
A window lists the options for filtering the results to show specific data.