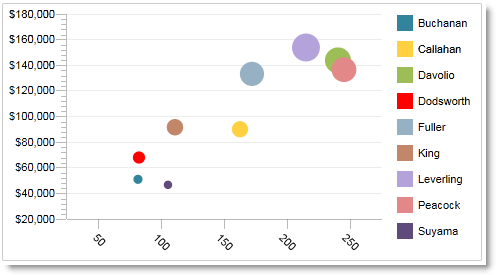
Bubble chart
Use a Bubble chart to display three variables in a 2-dimensional chart. Configure the Bubble chart with three data series representing the X-axis, Y-axis, and bubble size. You select the dimension to be represented by the bubbles. This chart is useful for animation.