Pivot
Use pivoting to move dimensions along rows or columns to change the information displayed, and the order in which it is displayed. Pivoting is available for charts, metric grids and scatter charts. Pivot tables are not available for record grids.
By default, the pivot table does not appear on a chart (except for a
scatter chart), it is available in the context menu. For scatter charts, this
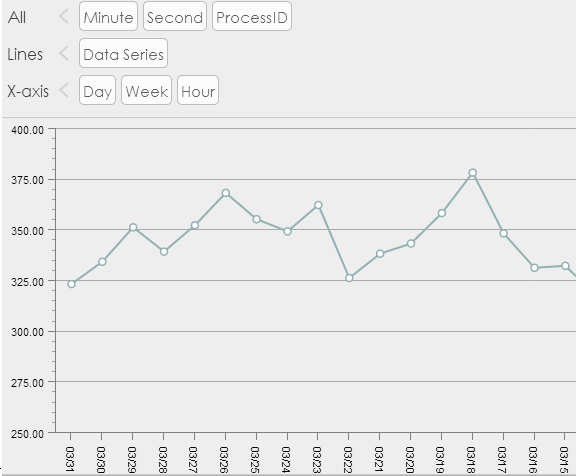
option is enabled by default. As you move dimensions within in the pivot
header, notice that the graph changes and responds to the placement of the
dimensions.
Explore data in the table
You can explore data in a pivot table by dragging and dropping the dimensions in rows or columns. The Dashboard Designer automatically generates the required table and expansion.
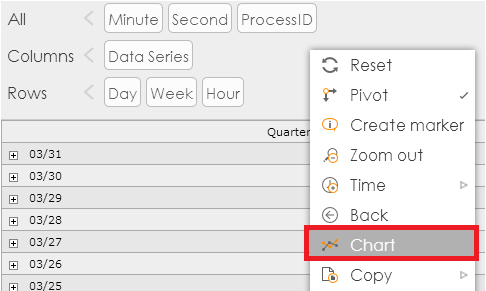
When more than one dimension is in a row or column, a small plus sign appears; click the plus sign to expand the column or row to access more details.
With the pivot table visible, you can convert a grid into a chart by
right-clicking anywhere on the pivot table and selecting
Chart on the context menu.