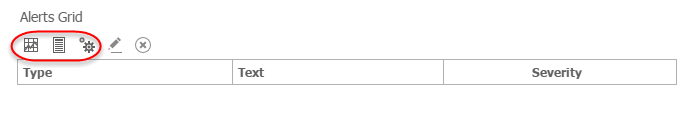
Create an alert
- Click and drag the Alerts Grid and Alerts Messages Grid onto the View area.
- Open the View in the Viewer application or in the Preview mode in Studio.
Alert properties tab
To configure the alert, launch the wizard screen by clicking either
the
New metric alert,
New record alert, or
New process alert
depending on the source of the alert.
- Specify the title of the alert. It appears in the Alerts Grid as the alert title and can be used as a subject line in the email of the alert.
- Specify the severity of the alert. Select Critical if you want this alert to display in a pop-up window. Select Important or Informational according to your needs.
- Enter the description for your alert. For the alerts generated on records or processes, you may use the fields from the corresponding objects to customize the alert, such as "Alert for <country>," where <country> is a record field.
- Frequency and Time Intervals: Use Check for alerts every to specify the frequency at which alerts should be checked. Use the starting from field to specify the start date/time of the time interval. So if the "starting from" date is set at 4/1/2016 12:00AM, the time interval for checking an alert is from 4/1/2016 to the current date. The time interval keeps growing. If you want to restrict the time to a specific length in time, select the Check backward check box and specify the length (in days, weeks, months, years etc). For example, if "Check backward" is selected and set to one week and "Check for alerts every" is set to one day, then every day the system checks for an alert with the time interval from current time to the past week. If the check backward period is older than the start from date/time, then the "start from date/time" is used as the "from date/time."
Condition tab
The Condition tab varies for different documents that you set as the alert source: a metric, a record, or a process.
To set the conditions for generating alerts based on metric values, you need to define what to compare (Operand) with what (Comparison). For the Operand, define the following.
-
Select the existing metric in the current project.
Note On-demand metrics are also eligible.
- Set the time interval for which the alert needs to be generated. For example, if you set it to one hour, but Check for alerts every is set to one day, the messages are generated for every hour but only once a day. If the metric has a daily interval, then hourly values are not calculated. The interval should not be less than the metric interval.
- Select the Use previous interval check box to use only completed intervals. For example, the interval is set for "1 day" and "starting from" is set to "2 p.m." Since the day is not yet finished and the data may change till midnight, you can select this check box to show only the data from previous completed days. If this check box is not selected, at 2 p.m. the data for the current day is shown for the period from 0.00 a.m. to 2 p.m.
-
Select the dimension under the
Broken by for which you
want to generate the alerts. If you do not select any dimension, then the
alerts are generated for the total data for each interval.
You can compare the metric data to some fixed value, another metric, or the historic value for the same metric.
- Select the operator for the comparison.
-
Select the basis for the comparison: Fixed value, Another
metric, or Same metric, historic value.
Note You do not have to set the margin for fixed value, because you can include the margin in the fixed value.
The value for the comparison is calculated according to the following formula.
Final value for comparison = CompareValue*(100 + Margin)/100
To set the conditions based on record values, you need to select a record and set the conditions for filtering it. These filters are added to the message header.
Note The maximum number of messages that can be generated simultaneously is defined by the Insight.Alerts.MaxMessagesCount parameter in the web.config file located in the WcfDataService directory in the Insight installation directory. - Browse for the record. Fields from the record are retrieved and displayed. Set the filters as required.
-
Select the
Send record data by email
check box if you need to send the record data by email.
To set the conditions based on processes, you need to select a process and set a filter.
- Use the Process state tab to be notified of any deviations related to your process states. Select the process state changes to be escalated.
- Use the Process timing tab to be notified of process deviations that occur within certain time intervals.
-
Use the
Process attributes tab to set notifications
for process attributes.
For example, you can set the condition for the dimension OrderID to start from XX. In this case (providing all other conditions are satisfied), you are notified each time a process instance appears with the OrderID=XX.
Do not send tab
Use this tab to set the conditions when the same messages should not be resent. Messages are considered to be the same according to the following rules.
-
For metrics: Messages with the same dimension value, by which the metric is drilled down by. If the values are only drilled down by interval, then such messages are also considered the same.
-
For records: Messages with the same values for the selected key fields.
-
For processes: Messages for the same process instances.
You can set the following conditions.
-
The time from the last alert generation is less than defined. For example, if the alert is scheduled to be generated once a day, the next alert is generated after one day since the last alert.
-
The same message has not been yet resolved. If this option is selected, the next alert is generated only when the same alert is resolved.
-
The same alert is already issued. If this option is selected, regeneration of the alert happens only when the previous instance of this alert is removed under .
Delivery tab
Use this tab to set the recipients for the alerts. The alerts can either be sent to an email address or displayed within the Insight system. If the alerts are set to be shown to Insight users, you must define a role that allows alerts to be viewed. Users assigned with this role can see the alerts in the Alert Messages Grid (for all alerts) or in the pop-up window (for critical alerts).
- Select and set up the mail server.
- Select the Roles check box and select the roles that apply.
-
Select the
Addresses check box and
enter the applicable email addresses in the Addresses field or select
By "Alert owner
service."
"Alert owner service" gets the data from the ALERTOWNERSERVICE table in the Insight Admin database. This table contains the rules (rows) that define which messages are sent and to which recipients. The conditions are defined by the parameters listed below. The system performs the checks and if passed, an alert is sent to the recipients emails listed in the RECIPIENTS column in the table.
Note Null in each filed is always considered as a match.ALERTOWNERSERVICE table
Column name
Data type
Description
Comment
ALERTNAME
[nvarchar](750)
A match is performed on the Alert name
SCOPEVALUE
[nvarchar](750)
A match is performed with the dimension value in the "broken by" field in the alert.
INTERVALSTART
[datetime]
Start time interval should be the same start time as the interval of the alert.
INTERVALEND
[datetime]
End time interval should be the same end time as the interval of the alert.
SEVERITY
[int]
0: critical
1: important
3: informational
If this value is less or equals (<=) the severity value of the alert, it is considered as a match.
For example, if this field is set to "critical" (0) and an alert with the "important" severity (1) is triggered, that means it is <= the alert severity and thus is considered a match.
ISESCALATED
[bit]
A match is performed on whether the alert is escalated or not.
0: No
1: Yes
RECIPIENTS
[nvarchar] (4000)
Contains a list of all the recipients separated by a semicolon.
For example, the table is populated as shown below.
ALERT
NAME
SCOPE
VALUE
INTERVAL
START
INTERVAL
END
SEVERITY
IS ESCALATED
RECIPIENTS
MyMetric Alert
US
null
null
0
null
US1@gmail.com;
US2@gmail.com
MyMetric Alert
US
null
null
1
null
US3@gmail.com
MyMetric Alert
BRAZIL
null
null
0
null
BZ1@gmail.com
In this case, when an alert is triggered with the dimension value (in the "broken by" field) = US, it is sent to US1@gmail.com and US2@gmail.com. If the alert has the severity "important" or "informational", the alert is also sent to US3@gmail.com. If the alert dimension value is BRAZIL, it is sent to BZ1@gmail.com.
Also, use this tab also to set escalation rules for the alerts. Select the time frame for "not resolved within," roles, email addresses or select By "Alert owner service." These settings are similar to the "Deliver alert message to" described earlier in this section.
Email template tab
Use this tab to set up the email template in plain or rich text to receive the alerts by email. The template can include preset fields as well as document properties, such as record fields or dimensions.
Web service configuration tab
Use the tab to make a web service call once an alert is triggered. Only the URL tab is required: the other fields are optional. By default, it sends an HTTP GET request. Select a template for web service call configuration, which is created under the Remote Services on the Documents Tree.
Use the scrollbar to navigate within the form.
- Verify that you have a saved remote service document, located under the in Studio.
- Web Service: Select the remote service document by clicking the ellipsis button. For example: https://www.myWebService.com/Alerts.
- Add query string parameters: Add a number of query strings to pass as parameters with the Web service call: click the Add new parameter link to add them. For records, add the field name; for metric alerts, add the dimension value.
- Use the HTTP Headers field to send data in the HTTP header.
- Use the Add field to data field to select the parameters to include in the service method response.
- Click Test to test the web service request.