Filter a component by a component with a behavior-based drill down
-
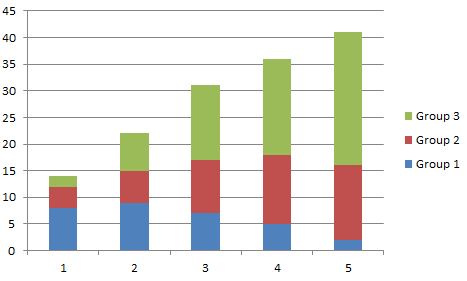
Create a chart broken down by a behavior-based drill down. For
example, to consider a chart drilled down by swimlane groups, see
Create and use swimlane groups.
- Configure this chart to work as a filter for other components. Open the and select the Use the value of the dimension as filter check box. Click OK to save the changes.
- Create a process component, such as a process chart. See Process chart. Open the and select the Current View check box.
- Open the charts in the Viewer. Now you can click a stack on the chart that is set up as a filter, and your process chart is filtered to show only those instances that correspond to the paths of the selected group.