Insight geo maps
Use the Geo Location feature to present your data on a map, based on geographic regions, such as countries, states, or counties. The map gives a visual representation of the quantitative data according to the selected filters or dimensions.
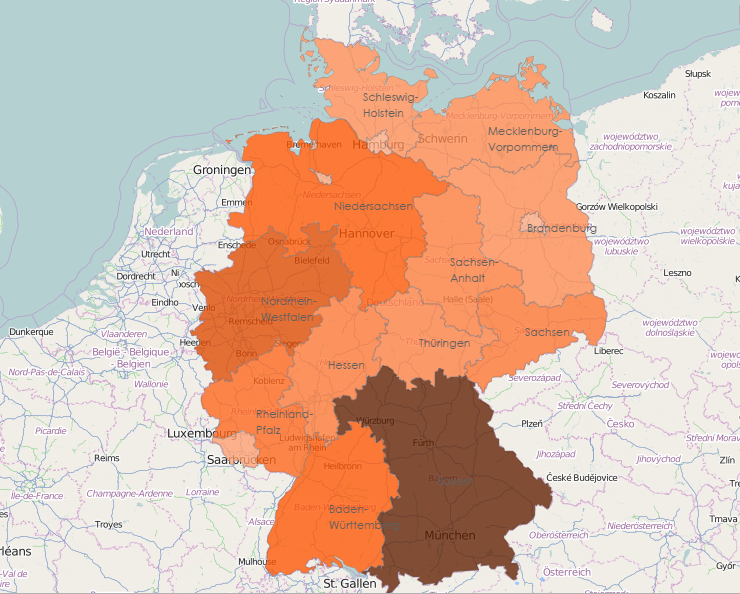
For example, you can create a choropleth map with shaded areas proportionally colored according to the data. The following example uses variations in color intensity to show the number of sales for different states in Germany.
If you need geo data for additional areas, see Add custom shapefiles.