Documents Tree
Use the
Documents Tree
to access Insight configuration data. You can click a document on the tree, or
right-click to access additional related options.
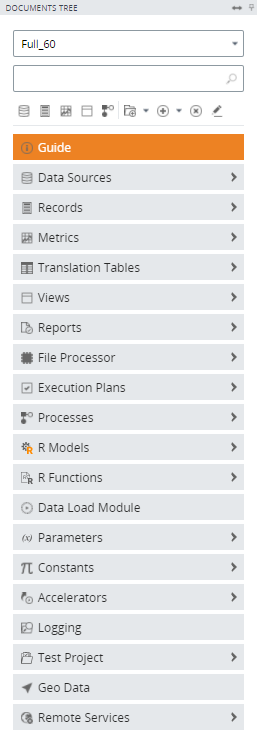
You can access any of the following items from the Documents Tree:
-
Project list: Open a drop-down menu that offers quick access to your saved projects in Studio.
-
Search bar: Search all of the Kofax Insight documents in the active project.
-
Quick access toolbar: View shortcuts to commonly used features such as Data Sources, Records, Metrics, Views, and Processes.
-
Guide: Open a window that lists steps for creating new metrics and designing a useful dashboard.
-
Data sources: View each data source, which contains the database connection or file configuration, such as connection strings, DBMS type, provider, or connection, and references to tables from a database.
-
Records: View each record, which defines a data set (database table); also referred to as Insight DataMart. Each record contains a mapping from source data to model data structure.
Note A record is not a row in a database table, but rather an entire set of data. -
Metrics: View each metric that contains calculation and aggregation definitions for a value such as a particular key performance indicator (KPI).
-
Translation tables: View each translation table, which stores the data value and its corresponding display value. For example, a translation table may contain an Error ID such as 404, 500 etc. with the corresponding text to display, such as "File not found, internal error." Use the translation table to display the text instead of the numeric value.
-
Views: List each View (or dashboard), which defines a container of components, such as charts and grids that you can lay out and configure.
-
Reports: Use to define the export of views (dashboards) to PDF, XLS, XML, or CSV.
-
File processor: Access the FTP file downloader, file transfers and file parsing. The components required to configure the file processor include batches, FTP sites, and templates.
-
Execution plans: Define a data load configuration (a set of documents, such as records, metrics, and scheduling). Each plan loads data from your data sources into your metrics and records.
-
Processes: Define a business process, which is a sequence of activities (steps) with transitions between them, based on a set of data.
-
R Models: Create R models based on the data from Insight.
-
R Functions: Create documents that contain R scripts and describe how to invoke R to calculate any field value.
-
Data load module: Open the module where you can load data from certain data sets, records, metrics, and time frames.
-
Parameters: View parameters that represent variables (not Insight variables) to use in derived fields and threshold definitions. The parameter value is editable by the user from the dashboard.
-
Constants: View predefined values used in various Insight documents.
-
Accelerators: Increase the performance of joins among multiple databases.
-
Logging: Display the audit records and changes made in metadata definitions.
-
Test Project: Access test cases and their results.
-
Geo data: Open a menu where you manage geo data and add custom shape files to use in map components.
-
Remote Services: Open a menu of current configurations for web service calls stored as Insight documents.