Group pins
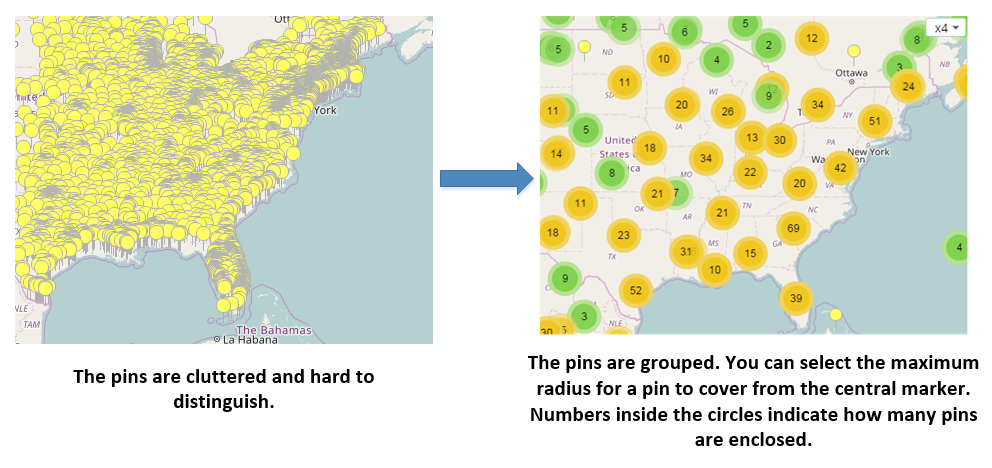
In some cases, pins on the map become cluttered too close together and
for a better presentation you can group them (for metric and record layers).
Grouped pins can be shown either as bubbles or images. Also, it is possible to
show grouped area boundaries when you hover over them, zoom to bounds, and
more. To use this feature, follow the steps below.
- Create a map component with a record or metric layer.
- Navigate to and highlight the layer to use grouped pins. Click the ellipsis icon under Details.
-
Navigate to
. Configure how to group the pins.
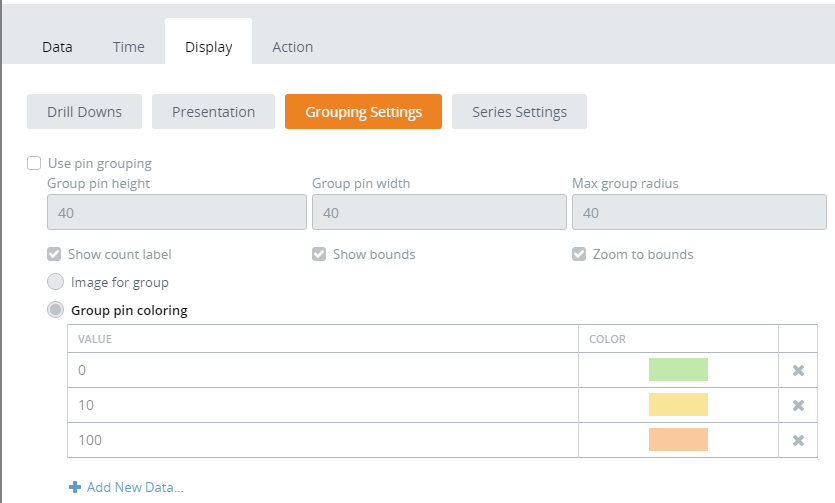
- Select Use pin grouping.
- Select
Show bounds to show the
bounds of its markers when you hover over it. The blue polygon shows the group
borders below.
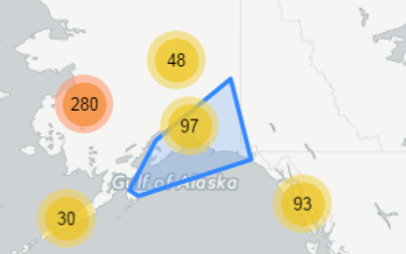
- Select Zoom to bounds to zoom the group to its bounds when you click it.
- Set Group pin height and Group pin width in pixels. Default is 40.
- Set Max group radius: the maximum radius that a group covers from the central marker in pixels. Default is 40. Decreasing will make more, smaller clusters.
- If required, select Image for group and attach an image file to replace bubbles with some custom image.
- Select Show count label to display values on the group pin.
- Use Group pin coloring to define pin colors depending on the number of pins in the group.
- Configure remaining tabs and click OK.
-
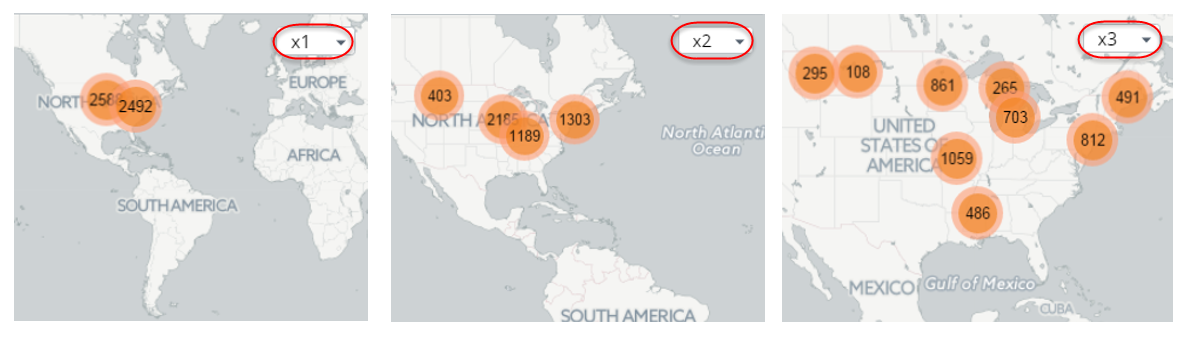
Open the map component in the Preview/Viewer.
All the pins are grouped and when you zoom in, the pins are split with each zoom level.
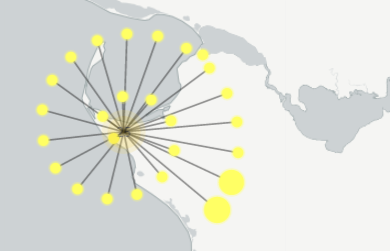
When you click the group at the bottom zoom level, all remaining markers are spread out in a form of a spider. Also, the spiderfy occurs at the current zoom level if all items within the group are still clustered at the maximum zoom level.