Create and use swimlane groups
- Create a swimlane chart and verify that the Collapse paths option is disabled (via the Property Panel). Open the component in the Viewer.
-
Right-click the chart and select
.
The swimlane chart enters the "grouping mode" where each click on the lane adds or removes it from the group.
-
Select the required number of paths by clicking them and click
Create group. Each
swimlane group is a different color.
The "New <process name> group" window appears.
- Name the new group and click OK.
-
Repeat the preceding steps as required and save the changes.
The swimlane groups are created.
- To change the colors for swimlane groups, right-click the chart and navigate to . Highlight the required group and use the Color column to adjust the color.
- To drill down the metric by swimlane groups, create a component to be filtered by swimlane groups based on the metric bound with the process, see Bind a metric or record with the process.
-
For this component under the
for the rows, the names coincide with
process names (the metric can be drilled down by swimlane groups).
For example, select the process name as a drill-down option for this metric in a component.
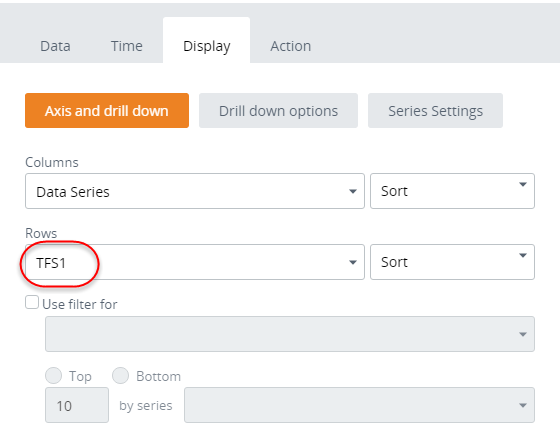
The metric is broken down by the swimlane groups that exist for this process.
The following rules apply:
-
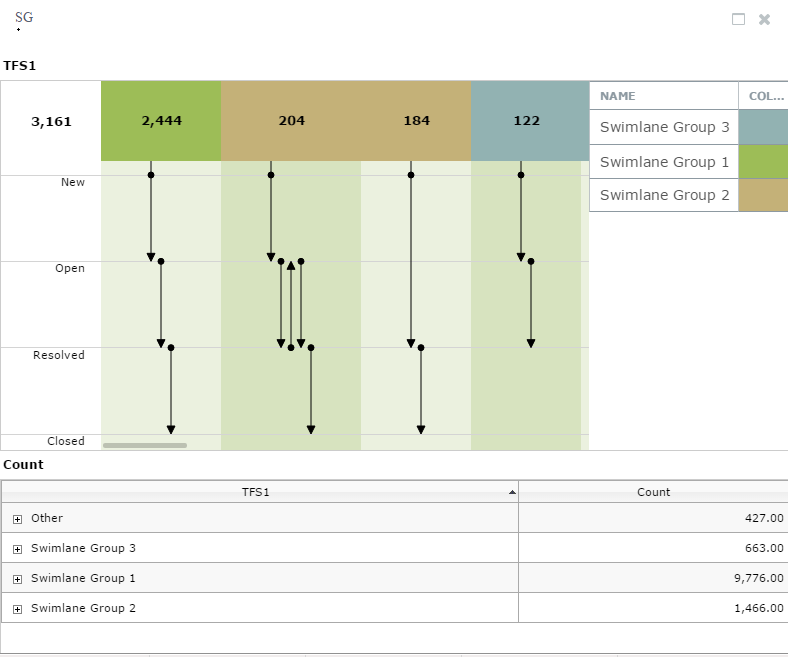
If the process to which the metric is bound has no swimlane groups assigned, the metric shows only the Other row, which is the default group for all instances that are not selected for groups.
-
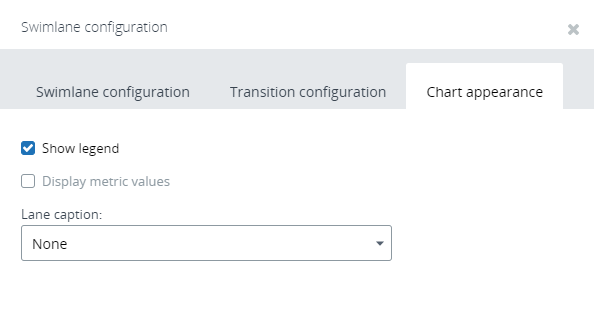
You may define whether to show the color legend for the groups. For the swimlane component navigate to the Show legend option on the Property Panel and select the required option. This option is also available on the context menu: right-click the component in the Viewer and select Process config.
-
Select Display metric values on the Swimlane configuration window to show the metric values for each swimlane group in the legend.
-
Edit swimlane groups
-
Open the swimlane component in the Viewer, right-click and
navigate to
.
The swimlane component is in editing mode.
- Each click on a path adds or removes it from a group. When the required paths are selected, click Create group.
Bind a metric or record with the process
You need to connect the metric or record with the process by assigning the Process key field property to the metric dimension or record field. This binding informs Insight about how to filter a metric or record by the process instances, which describe how key fields of the process correspond to metric dimensions or record fields.
You need to bind only standard metrics, because process metrics are bound automatically. Bind the records in the same way as standard metrics.
- In Studio, open a standard metric or record to filter by the swimlane groups or by the process filter definition.
-
Select the dimension and in the
Property Panel, select
Process key fields.
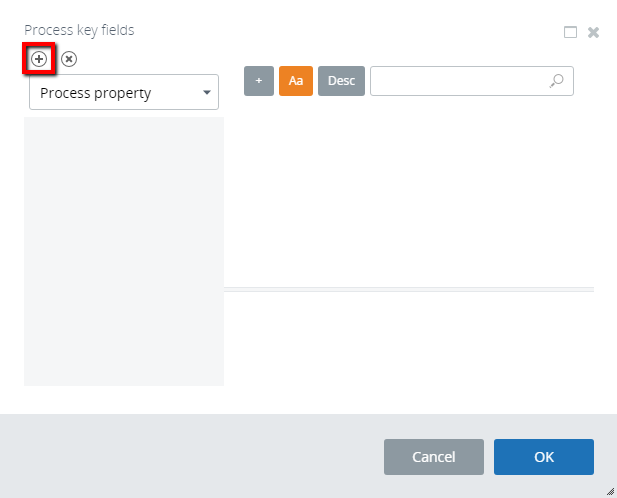
The Process key binding window appears.
-
Click the plus sign to add the required Process key.
-
For the
Property Panel
field, click the ellipsis button to select the required process and
navigate to the required property. Click
OK to save the changes.
Note Two separate dimensions of one record or metric cannot be bound to one key field of the same process.