Display metric values on process charts
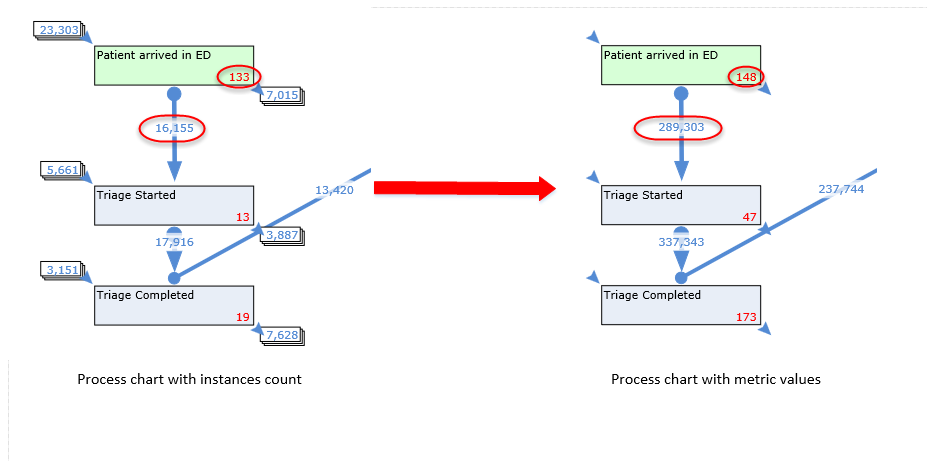
By default, a process chart displays a number of instances inside the step boxes, on the transition arrows and outside the step boxes (see Process chart). With Insight, you can bind the process chart with some metric and show metric values directly on the chart instead of the instances count. For example, you can use the metric that calculates the average age of the patients within the steps and within transitions.
- In Studio, on the View area, create a process chart.
- In the Property Panel, under the , click the ellipsis button and navigate to the required metric. The metric must be bound with the process. See Bind a metric or record with the process.
-
In the
Property Panel,
navigate to the
Display metric values
property and select the check box.
The process chart displays metric values filtered by all process instances that are currently queued in the steps (the value is shown in the lower right corner of the step box) or have already passed the transitions between the steps (the value is shown on the transition arrow).
-
To switch between these two modes of showing values in the Viewer,
right-click the process chart, navigate to
Process config, and
select or clear the
Display metric values
check box.