Scatter chart
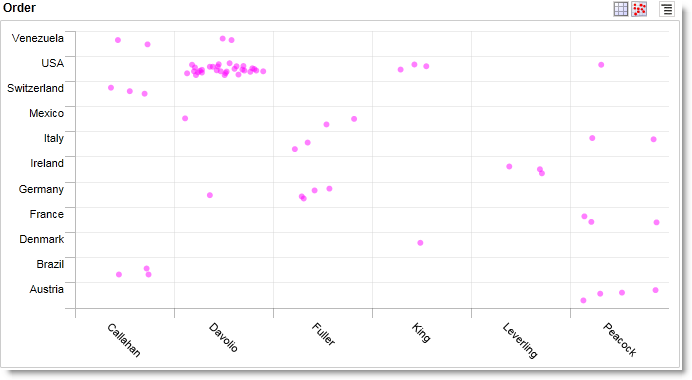
The Scatter chart plots a point for each record that makes up a metric. These points are plotted along the chosen axis, giving a visual image of the density of your data spread. As with other charts, pivoting is supported and can increase the usefulness of this chart.
The Scatter chart also supports statistical analysis of the data. Configuration involves selecting the record to plot and determining what fields are used on the axis and what fields are available for the user to pivot on.