Funnel chart
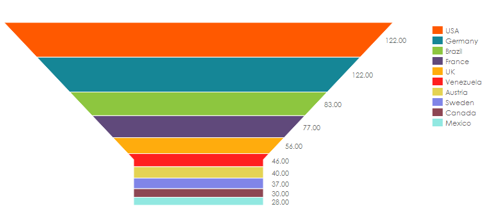
The Funnel chart is used to show progressive reduction of data as it passes from one phase to another.
This chart is commonly used to show sales conversion rates, including the number of leads received, the number of qualified leads, and the closure stage.