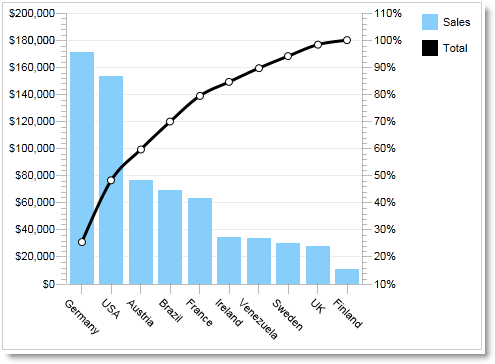
Pareto chart
The Pareto chart uses both a bar graph and a line graph. The bars represent individual values in descending order. The line represents the cumulative total. For this type of chart, you supply one data series and identify what the bars represent.