Reference lines (for charts)
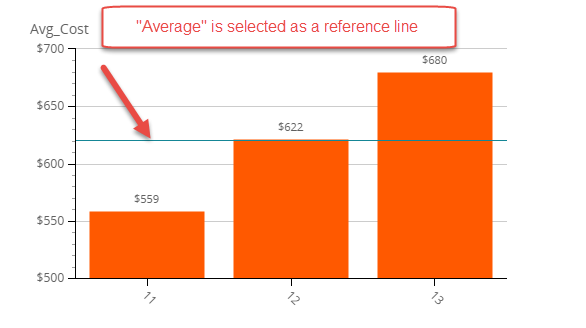
You can add a reference line to emphasize a specific value in your chart. For example, if your data includes salaries that you want to compare to last year's, you can display a reference line that represents last year's average salary. Also, you can use reference lines to show the average of the data series.
This series is shown only with one value as a line parallel to the X-axis.
- In Studio, create a chart. Add at least two data series. For a better visual representation, you can add two identical data series and then set one of them as a reference line. The first series is used to display the graph and the second series is used to display the reference line.
-
On the
Property Panel,
navigate to
Reference line type, and
select an option from the list for the required data series (the second data
series).
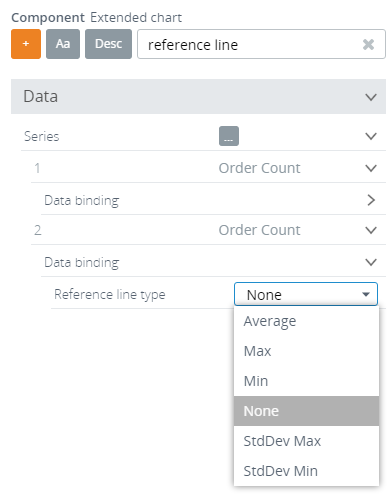
Possible options include:-
Average
-
Max
-
Min
-
None: Default setting. When selected, the data series is not shown as a reference line.
-
StdDev Max: Average + (plus) one standard deviation.
-
StdDev Min: Average - (minus) one standard deviation.
-
-
Save the changes
 and open the component in the Preview/Viewer.