Waterfall chart
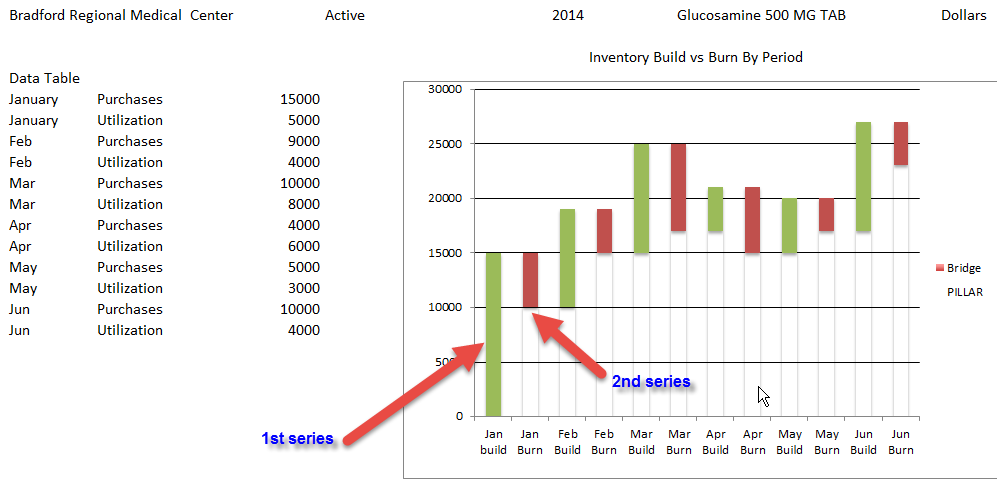
The Waterfall chart is used to show how an initial value is increased and decreased by a series of intermediate values, leading to a final value.
The Waterfall chart is used to show how an initial value is increased and decreased by a series of intermediate values, leading to a final value.