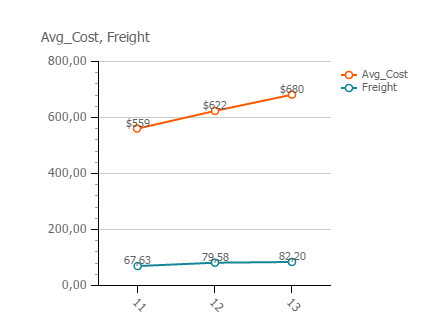
Line chart
Line charts show ordered data points connected by a line, and gaps in data are indicated by points with no connecting line. You decide what the line represents and what dimension is shown on the X-axis.
By default, you get one line per data series. However, you can select to have one line for each value of a dimension, such as one line per country or employee.