Guide
Use the online Guide as a reference as you become acclimated to Studio. The Guide lists the typical steps to follow to create the metrics and components necessary to design a useful dashboard. The Guide is available from the Documents Tree.
The Guide is also used to view a summary of statistical data related to the current project: the number of metrics, records, Views, and dates of the most recent changes for different documents.
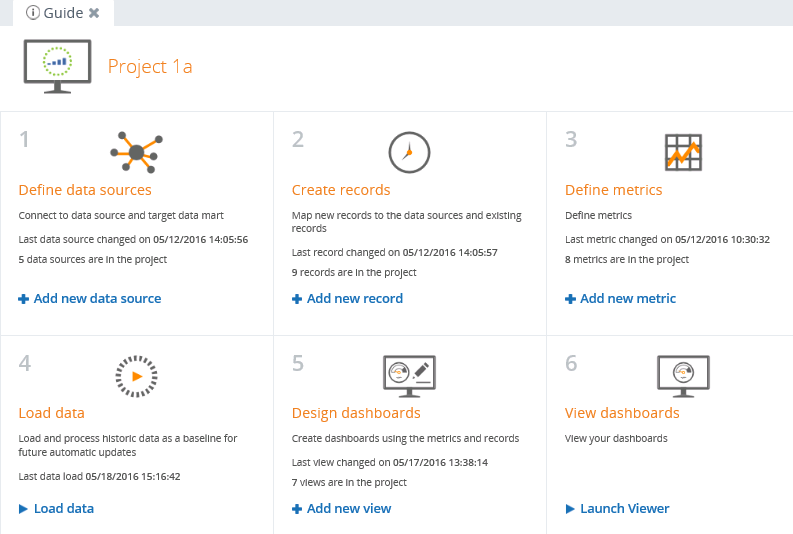
The Guide lists the following key steps.
|
Step |
Description |
|---|---|
|
Select from a number of data source formats, such as relational databases, flat files, web services, or Excel. In this step, you connect your data source to Insight. |
|
|
After defining and selecting specific tables for a data source, create a new record to represent business-level facts, transactions, or changes in the data. |
|
|
Define metrics to turn your record data into useful pieces of information to be represented in graphs, charts, and other visual formats. |
|
|
Extract data from the record data sources and performs metric aggregations and calculations for display on the dashboard. |
|
|
Create graphs, charts, and other visual forms based on your data. |
|
|
View your dashboards. This is an application for an end user. |