Process control chart
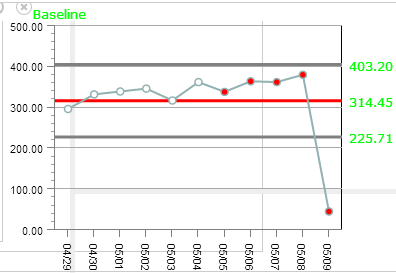
Process control chart displays the "deviation of the means." The chart displays the average metric values as a line chart, deviations as the range and the critical events as vertical lines.
Process control chart displays the "deviation of the means." The chart displays the average metric values as a line chart, deviations as the range and the critical events as vertical lines.