Use a regression metric (sample workflow)
Use this section to create charts or grids for a visual representation of the regression analysis. A regression metric is a derived metric with the regression module based on other metrics that the user selects as predictors of this metric. The following example describes how to create a regression metric for the rate of the Russian ruble versus US dollar to see the dependency of gas and oil prices on this rate.
-
Create a
regression metric. The example analyzes the
RUB/USD rate metric with the Gas Price and Oil Price metrics as predictors.
Select
"Month" as the dimension. According to the calculated p-values,
the Gas Price metric is unlikely to have a strong predictive effect on the
RUB/USD rate. You can remove it from the regression module, but for this
example. keep it. Name this metric as
"RUB/USD rate regression" and save
 it.
it.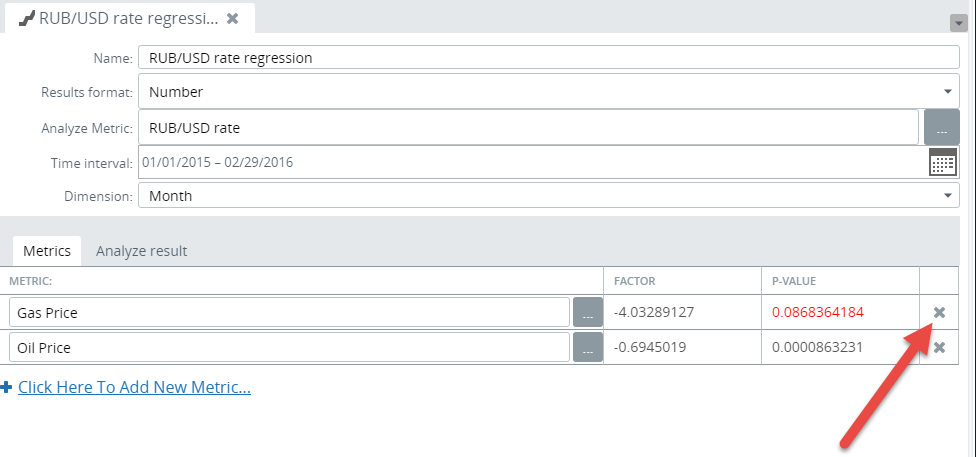
-
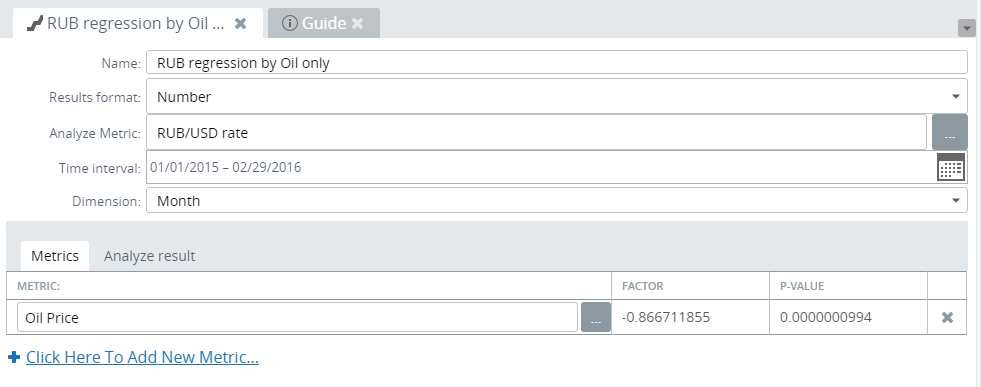
Create another regression metric as described in the step above,
yet built only on the Oil Price metric as being an efficient predictor. Name
this metric as
"RUB regression by Oil only" and save
it.
-
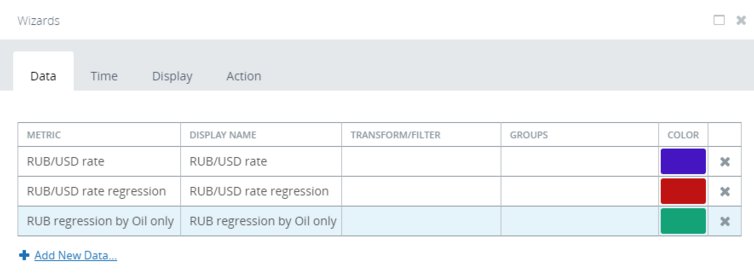
In
Studio, create a
chart, where the data is aggregated monthly by the average price. In the
Data wizard, add the following metrics:
-
The metric for RUB-USD rate based on real historic data (RUB/USD rate).
-
The regression metric based on oil and gas prices as predictors (RUB/USD rate regression).
-
The regression metric based on oil prices as predictors (RUB regression by Oil only).
-
-
Open the chart in the Preview/Viewer.
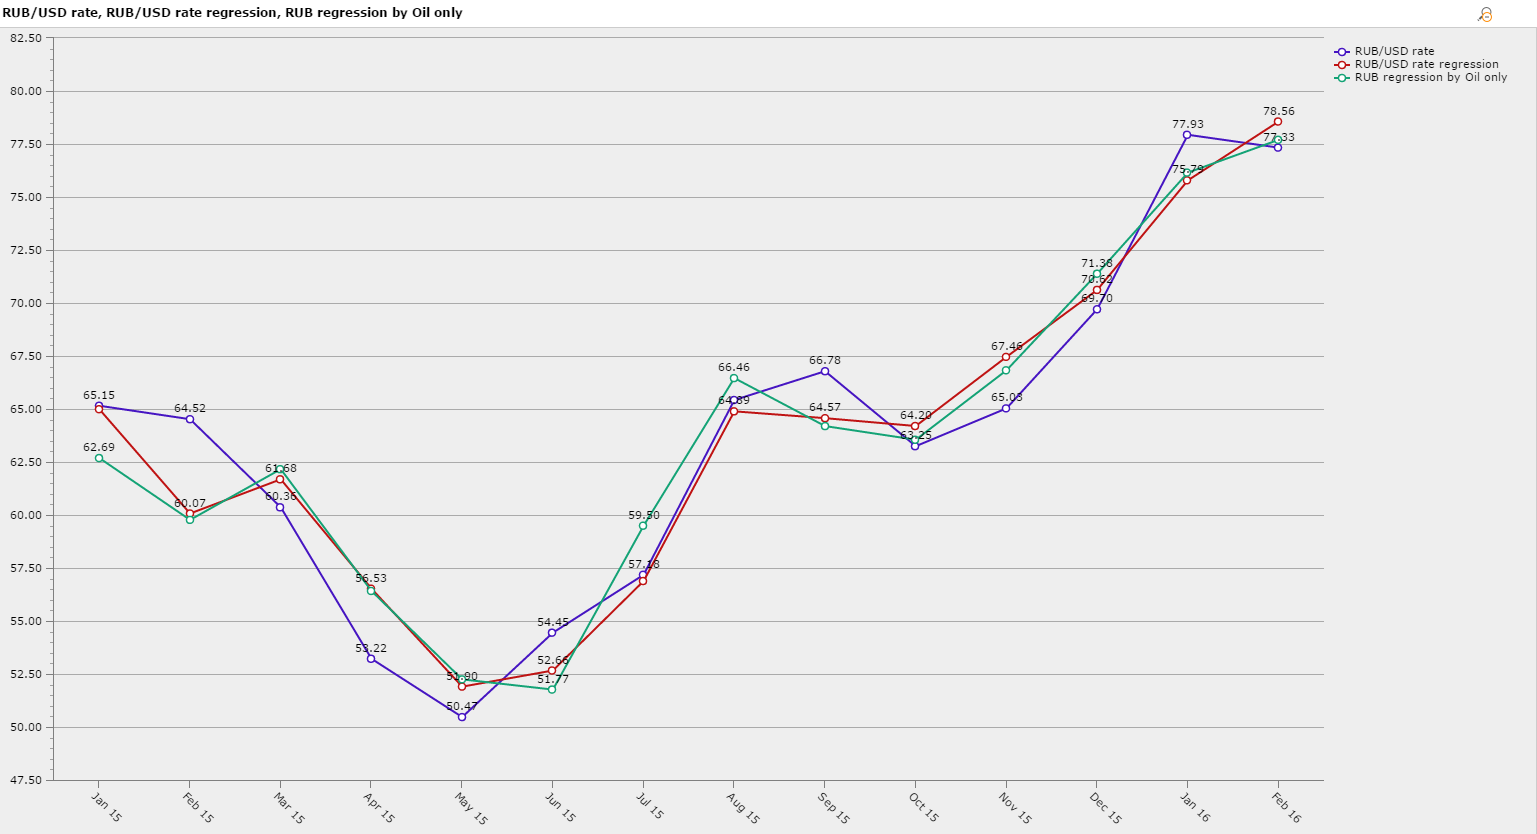
The RUB/USD exchange rate can be bound with the oil and gas prices quite evidently. At the same time, the regression metric based on oil prices only can also sufficiently predict the RUB/USD rate and thus this method is preferable as a simpler model. So, the suggestion for this case is to use the metric based on oil prices only.
-
We can add a parameter filter to play with the scenarios of drops
or rises in oil prices (the so-called
"what-if scenarios"). We create a parameter filter based on the
parameter created for the
"RUB regression by Oil only" metric, as described in
Use parameter filter for what-if scenarios.
Select
"Slider" as the display mode and open the View in the
Preview/Viewer.
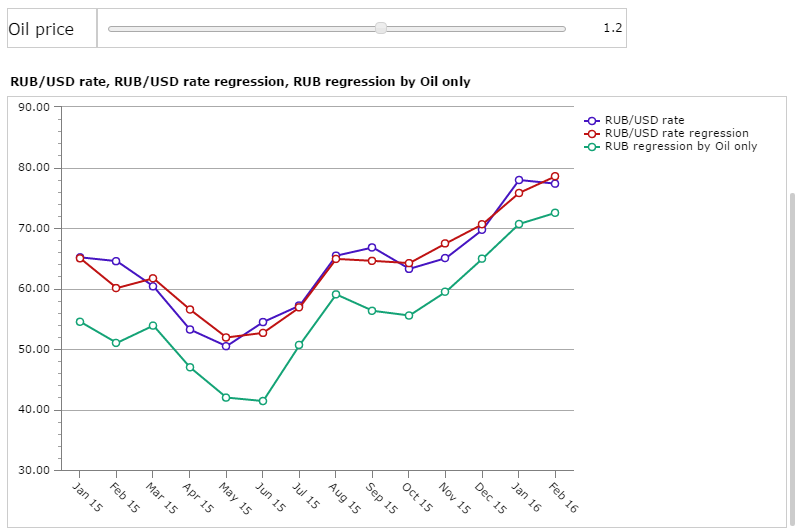
Change the slider to the scenario when the oil price is raised by 20%.
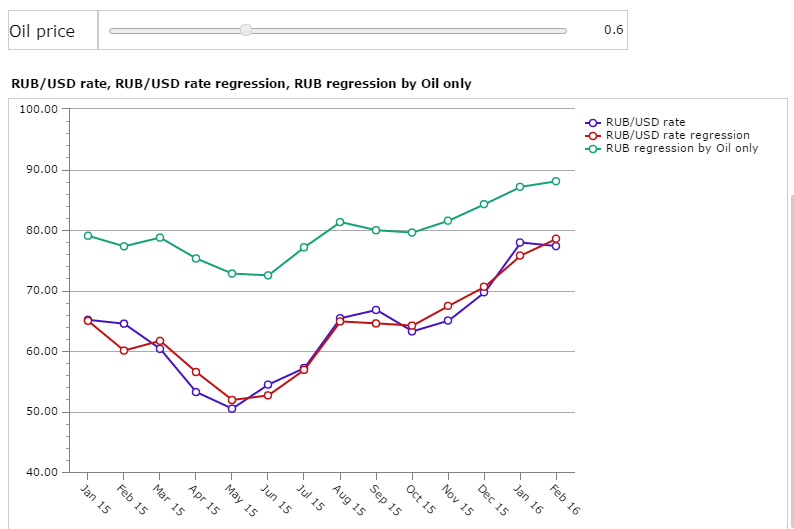
Change the slider to the scenario when the oil price drops by 40%.