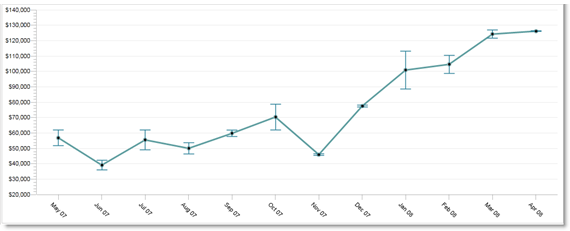
Chart with range
This chart requires two data series. One defines the metric to display as a line. The other defines the range to display around each point.
This chart requires two data series. One defines the metric to display as a line. The other defines the range to display around each point.