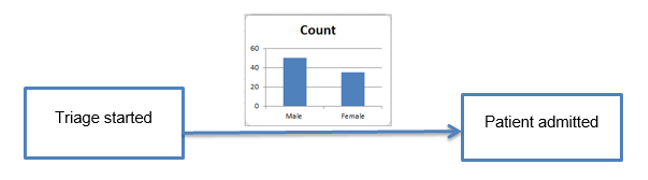
Dimensional breakdown in process charts
You can configure your process chart to break down a dimension in a
way that when you hover over the transition or click it, a chart appears
immediately over with the data broken down respectively.
-
Create a process chart.
-
Drag the process chart
 icon to the View canvas .
- On the Data wizard, set the required process. Also, you can add a process metric or any other metric bound with the process.
- On the Time wizard, set the time interval.
-
Drag the process chart
-
On the
Display wizard, open the
Drill down options tab.
Select Enabled.
- Select the chart type to be shown over the transition lines. Possible options include bar, donut, pie, and more.
-
Select the metric to use for the process chart.
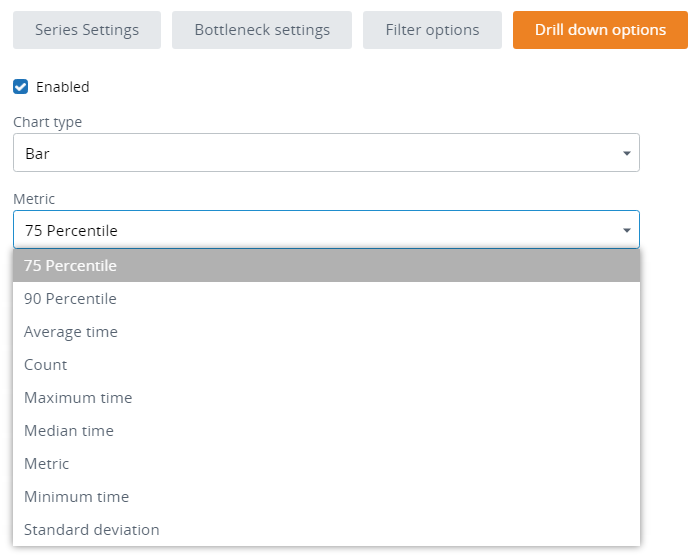
If you select Metric here, the chart is broken down by the metric specified in the Data wizard.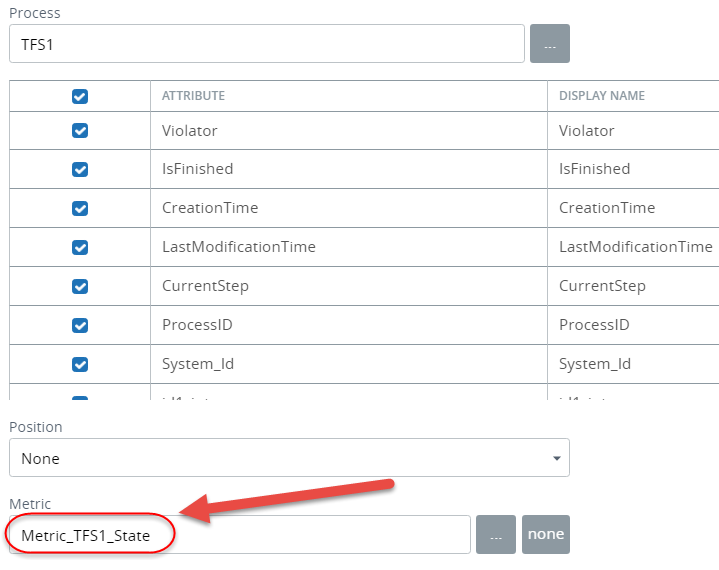
Note For example, to break down the dimension by gender, the process must have the "Gender" field mapped or the metric must have this dimension. Later, you need to assign this dimension to the drill downs (see the next step). - Select the dimension for Default drill down.
- Select dimensions for drill down under Drill downs. The drill down selected as default in the above step is also selected automatically.
-
Select the display type to be either a click or tooltip and click
OK. Open the chart in the
Preview/Viewer.
See the Drill down options section for the behavior.