Debug a process
-
Navigate to
.
A list of processes is displayed.
-
On the context menu of the process to debug, click
Debug. Alternatively
click
Debug on the process
Modeling bar.
The Debug page opens.
-
Enter the initialization variable values.
-
Process ID, name, and type variables are read-only fields.
-
If you select a process that is a case or fragment, then you must provide a case reference.
-
If a document initialization variable is in use, you can upload one document; this creates a new document instance.
-
If a folder initialization variable is in use, you can upload one or more documents, which will create a new folder for the documents.
-
TotalAgility does not support the following variable types in a debug mode:
-
Complex
-
Dynamic complex
-
Checklist
-
Data backbone
-
JSON expression
-
System
-
XML
-
XML expression
-
-
-
Click
Start. The process map
opens in debug mode in a new window as shown below. A job is created and
displayed similar to the View job behavior in the Workspace. An
asynchronization job is created for a business rule and a synchronization
process.
The Debug toolbar is displayed, which includes the following tools.
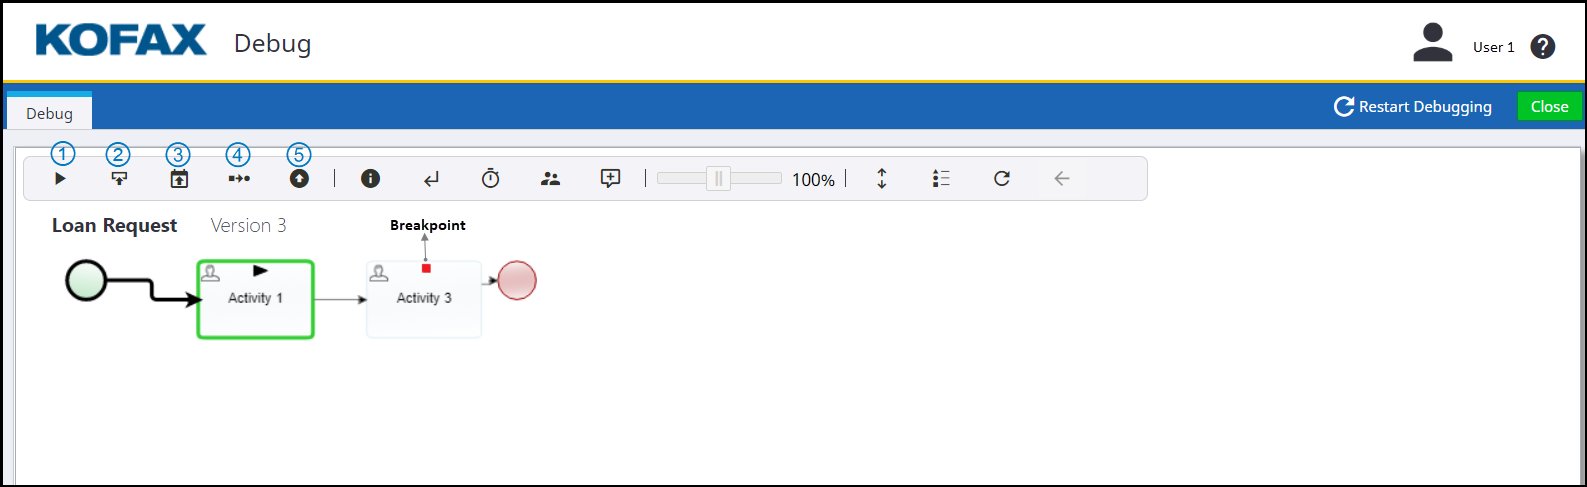
Tool Description 1 Go Debugs the process. 2 Show variables Displays all the variable for the job. You can change the variable values.
Note For an embedded process, variables for both parent and the embedded process are available. For a subjob, only the subjob variables are available.You can also view and update the input and output variables for each activity - click the activity, and click Show variables.
If a process in a debug mode contains a Scan capture activity, you can view the input and output variables, and upload one or more documents depending on whether the variable is a Document type or Folder type.
3 Show milestones Displays all the current milestones set for the process. You can change the target date and/or actual date of the milestones. 4 Show states Displays all the current states defined for the process. You can change the current state of the job. 5 Show events Displays all the current events defined for the process. You can raise an event. -
To set a breakpoint, click the activity and select
Set breakpoint.
The red square mark in the activity indicates a breakpoint. The Remove breakpoint, Disable breakpoint, and Enable breakpoint options become available. You can remove, enable or disable a breakpoint; left-click the activity and click the option as needed.
Note When you remove or restart the breakpoint, the first breakpoint is ignored and the execution of the activity is stopped at the next breakpoint. -
Click
Go to debug the process.
-
Manual activities and export activity are executed as Synchronization nodes.
-
Automatic activities including business rule activities, embedded processes, and subjobs are executed as they would in a normal mode. The execution stops at the next node that has a breakpoint set, and execution continues when you click
Go
. The job progresses only when all dependents are met. -
When debugging SignDoc and KCM activities you must set breakpoints on them to force them to be executed, otherwise they are performed like Synchronization nodes. Setting the breakpoints allows the debugging execution to stop and wait for callback from Signdoc and KCM servers.
-
-
If the execution stops due to a breakpoint, you can step through
activities to restart the job - click the node and click either option:
-
Restart next: Executes the current node and stops at the next node.
-
Restart here or Restart after: Restarts the job accordingly.
-
- Click Close to close the Debug mode.