Examples - Chart control
See the following examples for a Chart control.
Example 1: Display pie, bar, and column charts on a form
This example illustrates configuring the Chart controls to display Pie, Bar, and Column charts.
- Add three Chart controls to a form: Chart 1, Chart 2, and Chart 3.
-
Configure the Chart controls as given in the table.
Properties Chart 1 Chart 2 Chart 3 Title Chart1-Bar
Chart1-Pie
Chart1-Column
Query Live jobs (Job query)
All Work Due Today (Work queue query)
Live jobs (Job query)
Group by Job process name
Activity name
Activity process name
Number of segments 10 10 10 Show chart in 3D Refresh interval 0 seconds
0 seconds
0 seconds
Chart type Bar
Pie
Column
Padding 10px, 0px, 150px, 10px
10px, 10px, 10px, 10px
10px, 0px, 150px, 10px
Inner padding 5%
Legend position Right
Show legend Show pie with donut Show label Label length 20px
20px
- Save and release the form.
-
Open the form at runtime.
The Bar, Pie, and Column charts appear in the form as shown below.

-
Chart 1-Bar: This chart represents the number of live jobs and their respective job process names. In this case, the Inventory process has 3 live jobs associated with it, Sales has 2 jobs, Order has 3 jobs, Loan approval has 2 jobs, and the Accounts process has 2 live jobs associated with it.
-
Chart 2-Pie: This chart represents the number of works due today and the respective activity names. In this case Activity 1 has 12 works, Review order has 3 works, and the Credit Check activity has 2 works.
-
Chart 3-Column: This chart represents the number of live jobs and their respective activity process names. In this case, the Sales process has 3 live jobs associated with it, Marketing has 3, Inventory has 2, Analytics has 3, and the Accounts process has 4 live jobs associated with it.
-
Example 2: Get count, title, and ID of a chart segment
This example illustrates displaying the count, title, and ID for a chart segment.
- Create a form.
-
On the form, add the following controls:
-
One Chart control.
-
One text box control to display the count, title, or ID of a chart segment.
-
Three buttons to get the count, title, and ID of the chart segment.
-
- Add three Same page actions to the form. Associate one action each to a button. For example, you can set the properties of the chart control such as ClickedSegmentCount, ClickedSegmentTitle, and ClickedSegmentValue.
-
Configure the properties of the chart control as follows: For example, update the Query to "All activities" and
Group by to "Activity process name". See
Properties of a Chart control.
- On the Query list, select Work queue and select All activities.
- On the Group by list, select Activity process name.
- Save and release the form.
-
Open the sample form at runtime.
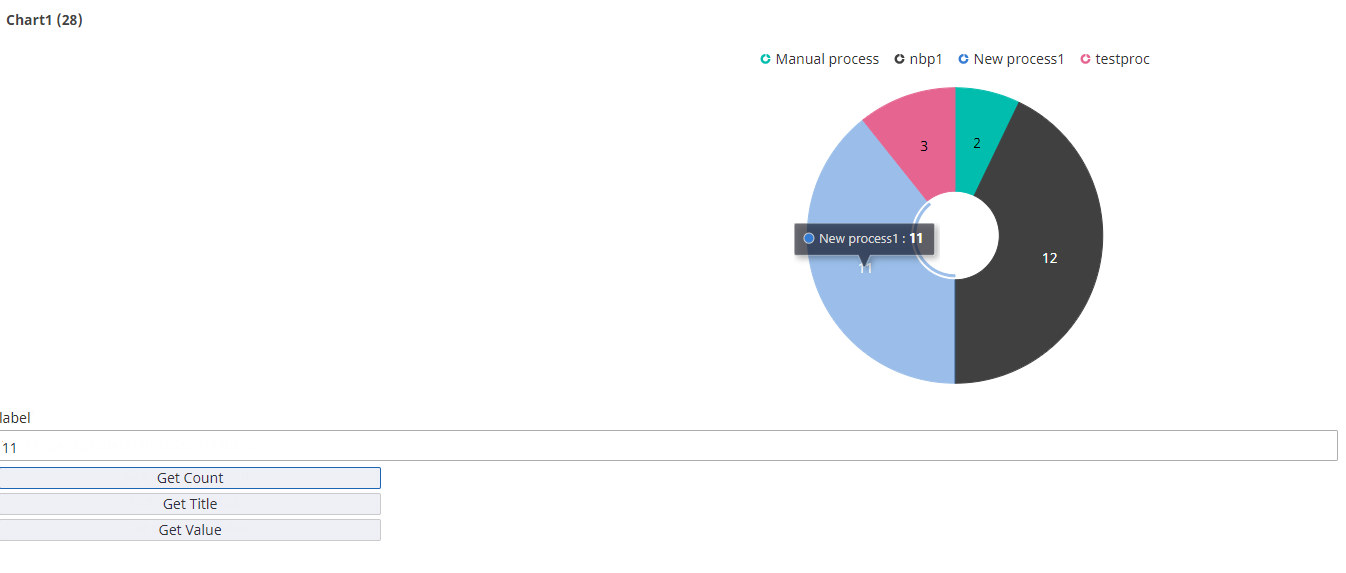
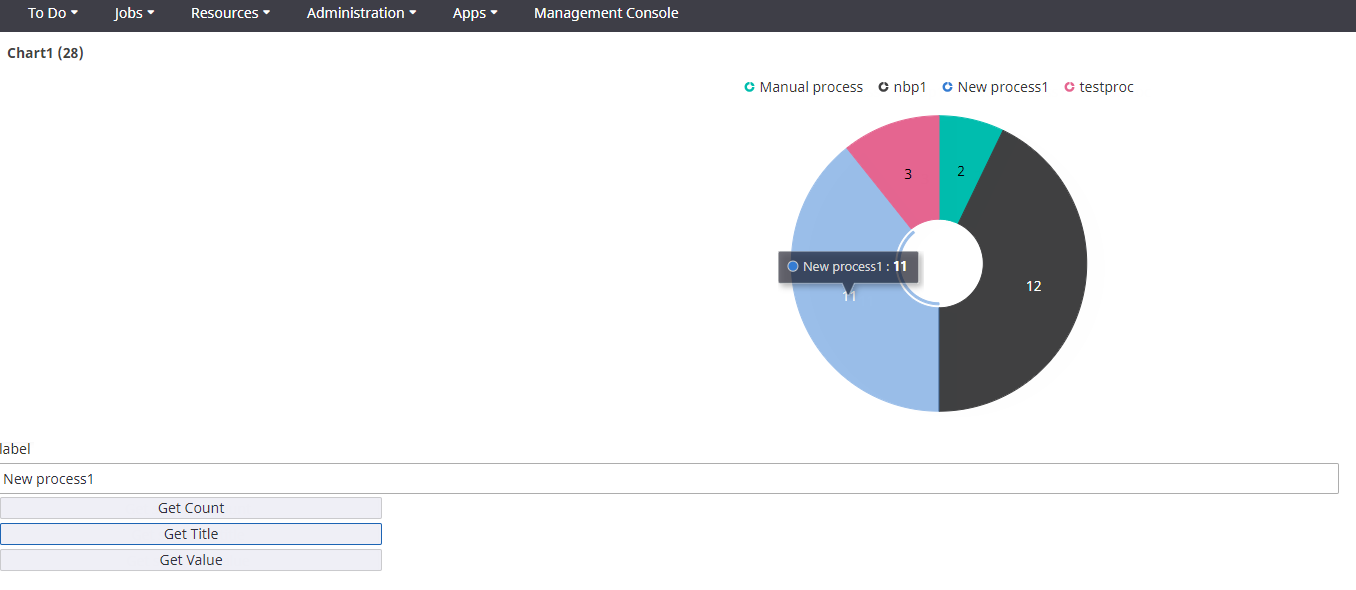
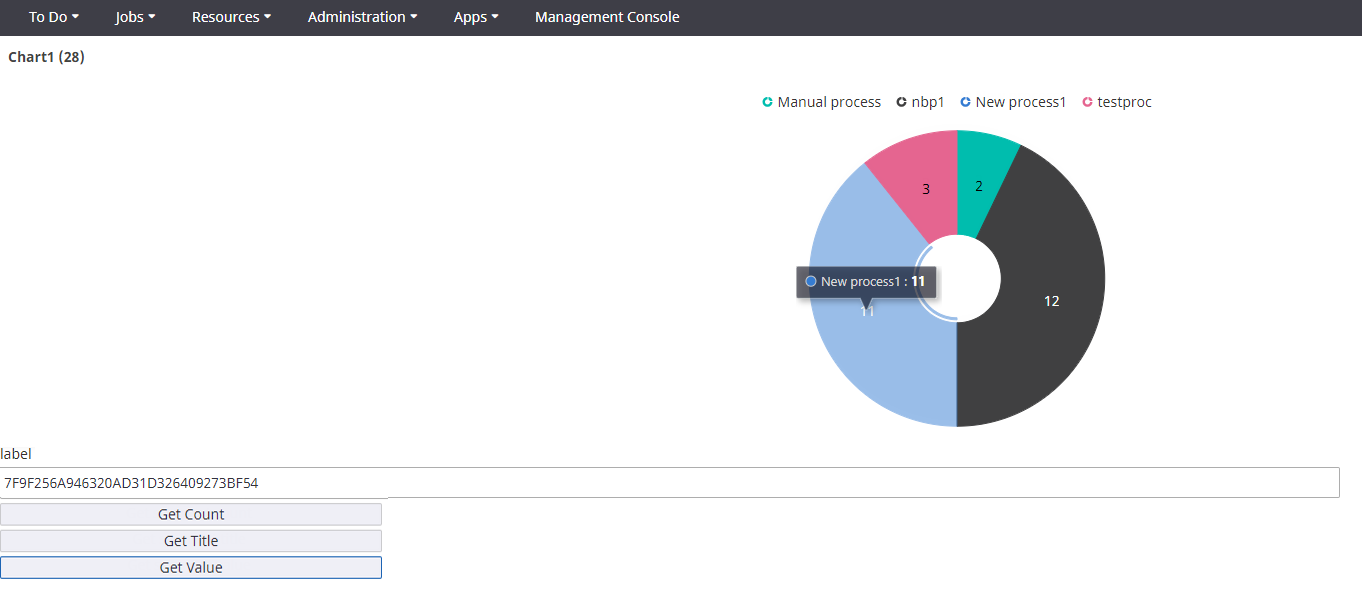
The pie chart appears as shown below.
When you click Get Count, then the count of all activities is displayed on clicking a chart segment. For example, "11" is displayed as the count for the New process1 segment on this chart.

When you click Get Title, then the title is displayed on clicking a chart segment. For example, "New process1" is displayed as the title on this chart.

When you click Get Value, then the ID is displayed on clicking a chart segment. For example, "7F9F256A946320AD31D326409273BF54" is displayed on clicking the "New process1" segment.

Example 3: Charts (Pie and Line) displaying the count of activities due for hour
This example illustrates displaying the number of activities due based on hours, on a Pie and Line chart.
- Add a Chart control to a form.
-
On the
Configuration tab of the Chart control, configure the following properties:
-
Query: On this list, select .
-
Group by: On this list, select Activity due date.
-
Time series: On this list, select Hours.
-
Chart type: On this list, select Pie.
-
- Save and release the form.
-
Open the form at runtime.
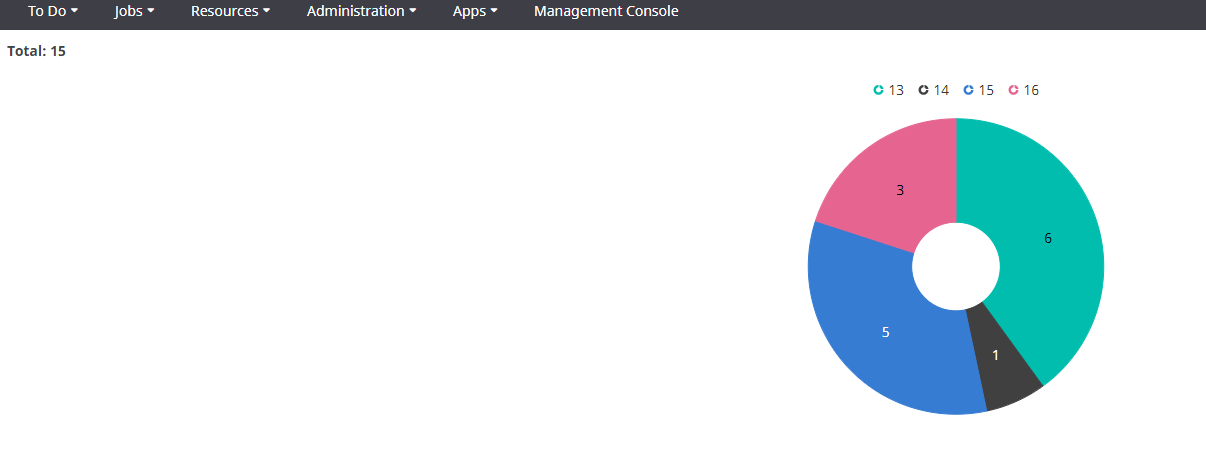
The Pie chart showing the number of activities due based on hours is displayed on the form.

This example chart displays that 6 activities are due on the 13th hour, 1 activity is due on the 14th hour, 5 activities are due on the 15 th hour, and 3 activities are due on the 16 th hour.
If you select the Line chart (single series) at design time, the following chart is displayed at runtime where, the X-axis displays the time interval and Y-axis displays the count of activities.
