Box plot chart
The Box plot chart is a convenient way of graphically depicting groups of numerical data through their quartiles. Box plots may also have lines extending vertically from the boxes (whiskers) indicating variability outside the upper and lower quartiles.
- In Studio, select Box Plot and drag it to the View editor.
-
On the
Wizards screen, define data for the chart.
-
On the
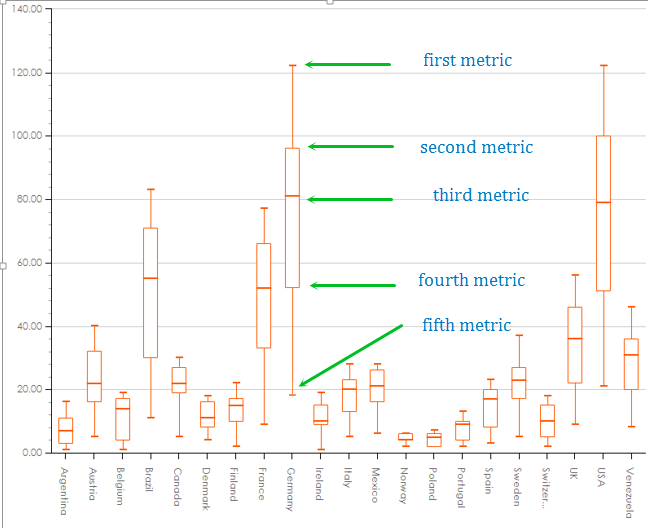
Data tab, select five metrics.
Review the explanation on the tab. If you add more than five metrics, only the first five are considered for the chart.
- On the Time tab, set the time parameter.
- On the Display tab, define the display properties.
- On the Action tab, define incoming and outgoing actions.
Overview for breaking down data:

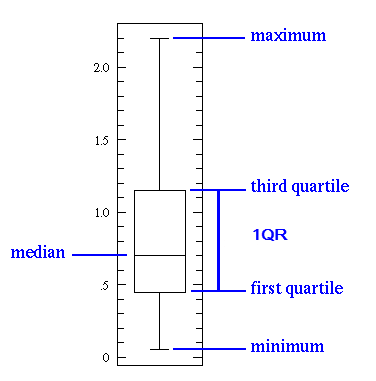
Here is a sample box plot diagram:

-
On the
Data tab, select five metrics.
