Behavior-based analytics
Behavior-based analytics use "dimension performance" (customer satisfaction, case closure ratio, etc.) as a dimension to break down the data. This approach differs from traditional analytics, which use an aggregated data set broken down by a dimension.
With behavior-based analytics, you can compare the paths and see the result for the process when you do it in one way, compared to doing it in another way.
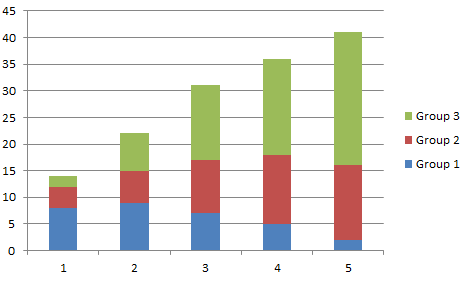
With this approach, you can create groups of paths (swimlane groups) based on your process, create a metric tied to this process, and break down your data. Typically, we recommend metrics that calculate averages or percentages to achieve a better visual representation of the results. For example, you can break down process paths to see that the customer satisfaction was X% for one group of paths and Y% for another group of paths.
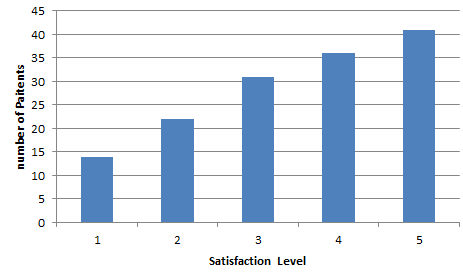
For example, the patient satisfaction metric (levels from one to five) is calculated for all patients.
You can combine certain swimlane paths in groups and compare the satisfaction level broken down by each group.
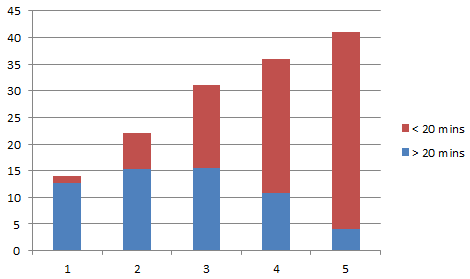
You can also define a process filter to verify whether process instances satisfy it or not. For example, you can set the filter to see if the process path meets certain time guidelines.
In this case, you can see how the customer satisfaction changes if the path is performed within a certain time frame. You may also select to see all instances where the waiting time is more than 20 minutes or where some step is missed. In this case, process behavior is used not just as a filter, but as a metric dimension (Yes/No value).