Process chart
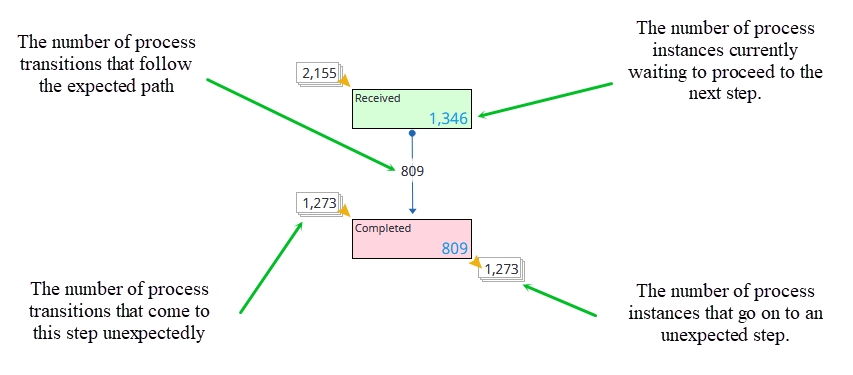
The Process chart shows the expected process path, as defined in the process definition in Studio. This diagram illustrates how many transitions follow each path and how many are still at each node.

The Process chart shows the expected path: Designed in process or based on the auto layout for the selected process scheme mode. Note that some process instances arrive at nodes through alternate paths. Rather than drawing all paths and having the diagram get cluttered, the chart shows the instances entering and leaving a node through an alternate path as lines come in from, or lead to, nowhere.
Define process chart with auto layout
You can define a process chart with an automatically generated layout for a certain set of instances.
-
In the Property panel, for the Apply auto layout option, select the Vertical or Horizontal option as applicable. After you enable the auto layout mode by making a selection other than default, other settings are available for configuration.
-
Define the process scheme mode.
-
Use additional options to generate the layout for a process chart.
Define process scheme mode
Use the context menu of the component or the Property Panel to define the Process scheme mode. The process scheme includes all steps and transitions from the selected paths.
-
Top N paths: In this mode, you can select the number of paths used most frequently to create the scheme. On the Property Panel, find the Most popular paths property and define the number of Most popular paths (N). In this mode, the collapsed path is used to define the most popular paths.
-
Top % instances: In this mode, you can select paths based on most popular paths (for example, a path that covers at least 50% of instances). On the Property Panel, find the Most popular paths and define the number of paths (N), from 0 to 100. In this mode, the collapsed path is used to define the most popular paths.
-
Fixed paths: In this mode, you can select paths to generate the scheme using the existing swimlane groups. If you select this mode and no groups are selected, all paths will be used. Also, you can select the default paths from the Edit mode. In addition to manual selection, you can use the Path filter group property to define the filter group and select the swimlane groups from the external driver component to filter the process chart. In this case, add the Driver component to set the swimlane group. A combination of manually selected swimlane groups and filter groups will be used.
Also, you can select the Filter instances by path option to display instances only from the Fixed paths or Most popular paths.
Auto layout settings
In the Property panel, use the following options to generate the layout for a process chart.
-
Hide repeated transitions: Use this option to hide the repeated transitions. Also, this option is available for users in .
-
Hide exception steps: Use this option to hide the steps that are not included in the process scheme for the selected path mode. If you hide the exception steps, the exception transitions are not displayed, too. Only the Start transitions are included in the chart. Also, this option is available for users in .
-
Hide excluded steps: Use this option to hide the steps that are manually excluded from the process scheme. Also, this option is available for users in .
-
Hide steps without data: Use this option to hide the steps without "From" and "To" transitions. Also, this option is available for users in .
