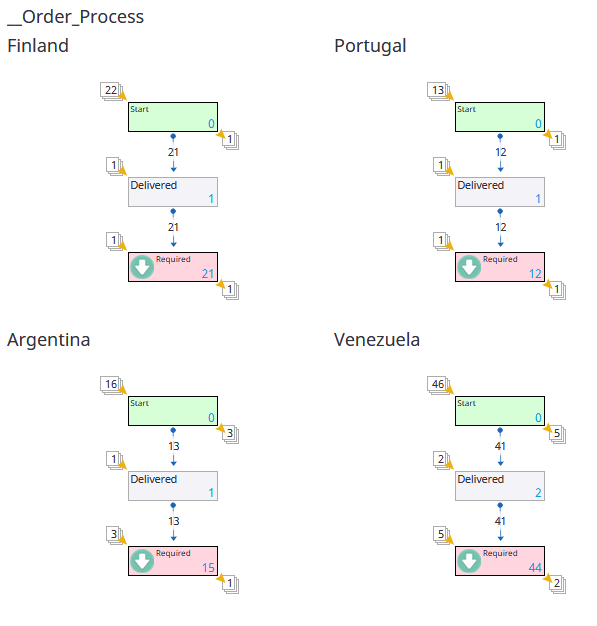
Process trellis chart
The Process trellis chart provides the ability to compare processes and swimlanes by dimension values.
You can use it to see the average time from step X to step Y in the process between different shifts, locations, and more. The process view and a swimlane view are shown side by side in a trellis chart.
Note If you drill down the process trellis chart by the time
dimension, the
Finished(LastModificationDate) time is used for grouping.