Group items in categorized charts
To simplify displaying data on categorized charts (bar, line,
area, pie, and donut), you can allow the user to group selected chart segments
or bars as
Others.
This feature may be helpful for reports with large amounts
of data to avoid overwhelming the chart.
- In Studio, open a View with the required categorized chart. For example, a bar chart.
-
Highlight the chart and in the
Property Panel
find the
Can group property. These
properties reside under the
Data category for each
metric dimension of the chart.
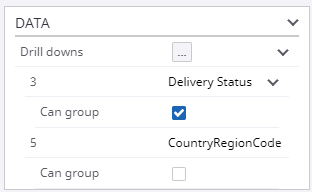
-
Select the check boxes for the required dimensions and save
 the changes.
-
Open the component in the Preview/Viewer.
The context menu of the component now has the Grouping option that you can use to combine bars (in a bar chart) to
Others.
See the Kofax Insight Viewer Help.Note This option appears only when the grouping mode is enabled for the X-axis dimension and the top-bottom filter is disabled.