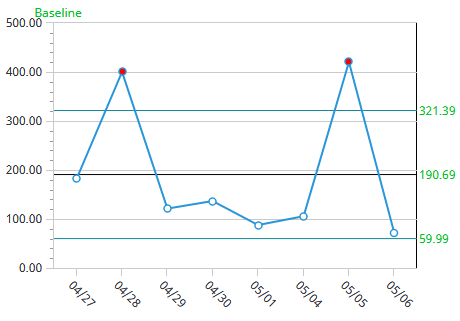
Process control chart
Process control chart displays the
deviation of the means.
The chart displays the average metric
values as a line chart, deviations as the range and the critical events as
vertical lines.
The search returns topics that contain terms you enter. If you type more than one term, an OR is assumed, which returns topics where any of the terms are found.
The search also uses fuzzy matching to account for partial words (such as install and installs). The results appear in order of relevance, based on how many search terms occur per topic. Exact matches are highlighted.
To refine the search, you can use the following operators:
Note that operators cannot be used as search terms: + - * : ~ ^ ' "
Process control chart displays the
deviation of the means.
The chart displays the average metric
values as a line chart, deviations as the range and the critical events as
vertical lines.