Spark line chart
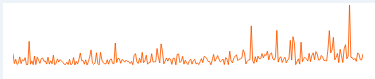
A Spark line chart concentrates a lot of data in a small graphic. It is essentially a small line chart without the axes displayed. Spark lines are usually most effective when they are displayed near the data they represent.
The search returns topics that contain terms you enter. If you type more than one term, an OR is assumed, which returns topics where any of the terms are found.
The search also uses fuzzy matching to account for partial words (such as install and installs). The results appear in order of relevance, based on how many search terms occur per topic. Exact matches are highlighted.
To refine the search, you can use the following operators:
Note that operators cannot be used as search terms: + - * : ~ ^ ' "
A Spark line chart concentrates a lot of data in a small graphic. It is essentially a small line chart without the axes displayed. Spark lines are usually most effective when they are displayed near the data they represent.