Debug a form
You can debug a form, including capture forms (Scan create new job, Scan, Document review, Validation and Verification).
To debug a form, perform the following steps.
Launch a form in a debug mode
When you launch a form in debug mode, the primary form is loaded as per the runtime behavior.
-
Navigate to
.
A list of forms is displayed.
-
On the context menu of the form to debug, click
Debug.
Alternatively click Debug on the form Action bar.
The form opens in the debug mode in a new browser window. The Form initialization pop-up appears. A list of form and global variables set as initialization variables in the form appear. A dropdown (if available) only shows the selected value and not all possible values.
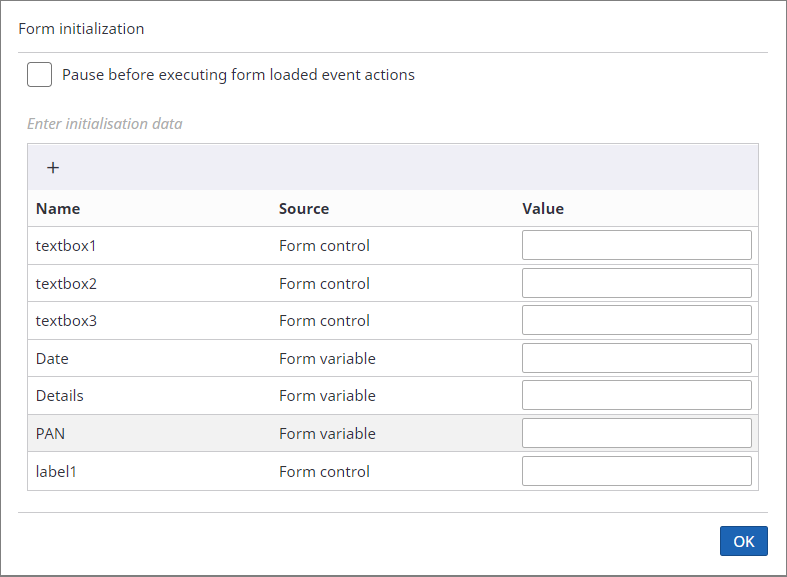
- You can add a breakpoint to any action, such as .Net action with a button click event. To add a breakpoint on form load, select Pause before executing form loaded event actions.
- Update the values of the initialization data.
- Click OK.
Set breakpoints
A breakpoint is an intentional stop or pause in a program and is used for debugging purposes. It is also sometimes
referred to as a
pause
. For example, you can set an event at a breakpoint on a form. You cannot set breakpoints on the
Before render
and
After render
form events or on
Begin condition
,
Else condition
and
End condition
actions.
-
In the Debug window, click
for
Breakpoints.
The Breakpoint dialog box is displayed. A tree of the form with all corresponding controls, events and actions associated with each, is displayed as shown below.
-
Form
-
Events
-
Configured Action 1
-
Configured Action 2
-
-
-
Control 1
-
Events
-
Configured Action 1
-
Configured Action 2
-
-
-
Control 2
-
Events
Note You cannot debug any action configured in Before render and After render events. You can debug only actions in Form Load event. -
-
-
Add the breakpoints.
The selected breakpoints are added to the Selected items list .
- Click Done.
-
To skip an action within a form execution, click
for
Actions to skip.
The Form action dialog box is displayed.
-
Add the actions.
The selected actions are added to the Selected items list.
-
Click
Done.
The status of the actions is updated to skipped in the stack trace.
Note When you are loading and debugging the form for the first time, if you selectPause before executing form loaded event actions
the first action cannot be skipped. You need to restart debugging and then add the actions to be skipped.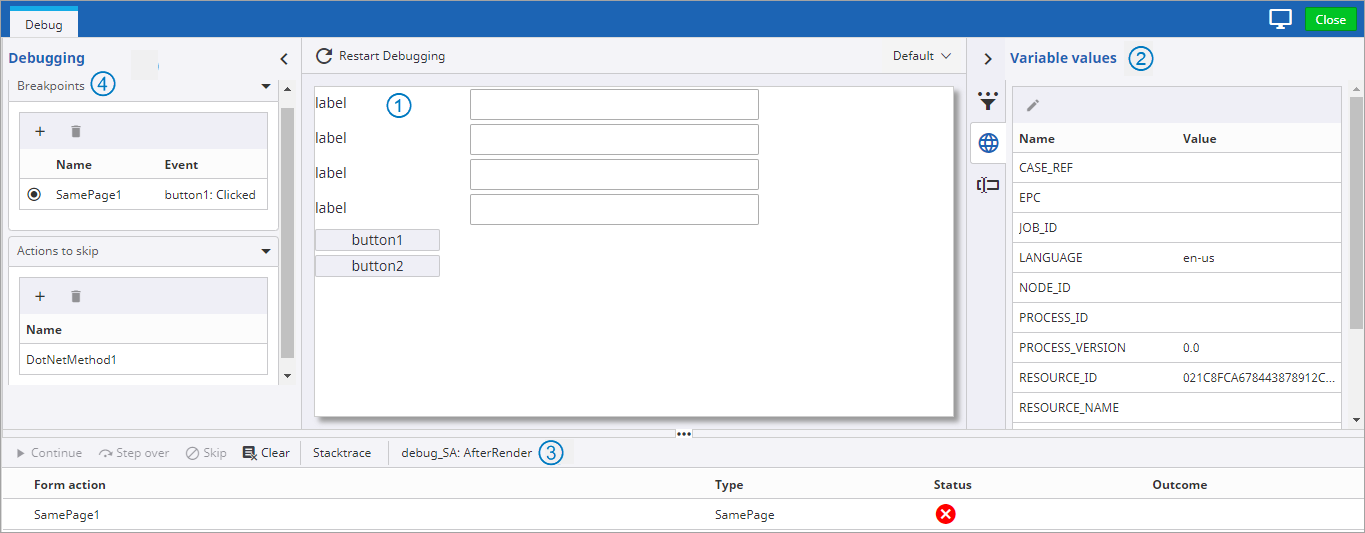
Panel Description 1 Form
The controls of the current form appear in this panel.
2 Variable values panel
Lists the form and global variables, and form controls.
Note You can view and update the variables and controls in this panel. You can also view the controls which are in hidden state.3 Stacktrace panel
Lists the actions in the order of execution.
4 Breakpoints panel
Lists the events for which you have set the breakpoints.
-
Once a breakpoint is set, you can invoke the events on the form load.
-
To invoke any breakpoints on the "On load" event of the form, refresh the main page.
-
To invoke an event on a control, interact with the form itself. For example, click a button or select a row within the table.
Once the event is invoked, the Stacktrace panel displays the following actions. The status of the actions is updated as they are executed until it reaches the first breakpoint. You can choose to continue execution or step over an action.
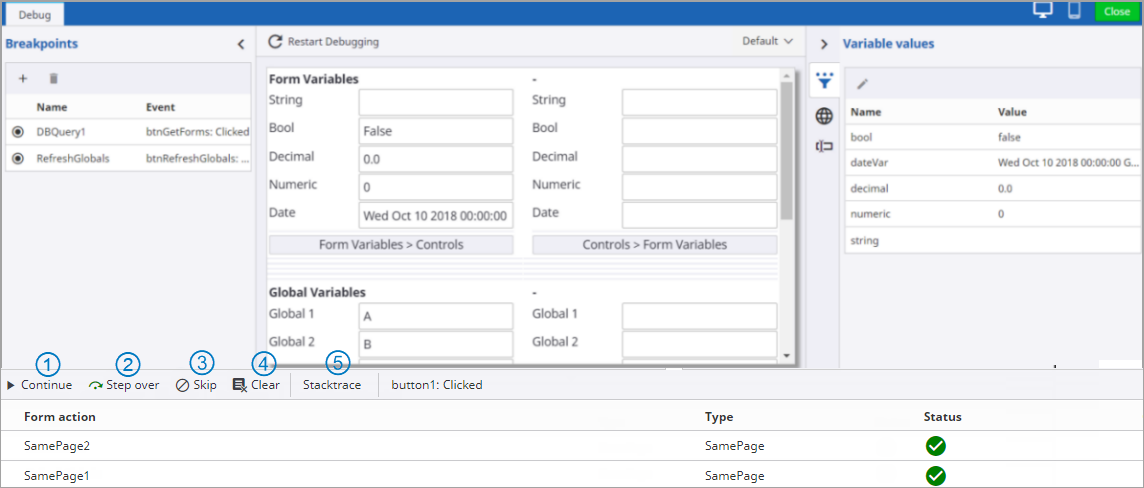
1
Continue Continues execution to the next enabled breakpoint.
2
Step over Executes current action and stops at the next action in order.
3
Skip Skips the selected action while debugging and the status is updated to skipped. See the example below.
4
Clear Clears the stack trace panel.
5
Stacktrace The list of actions for execution.
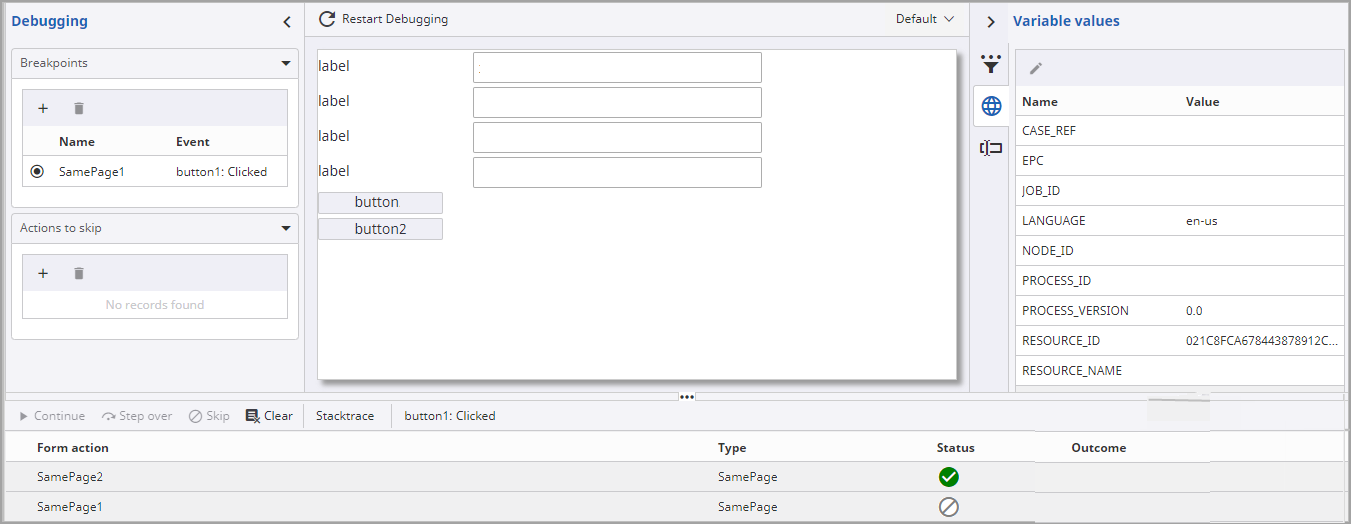
Skip an action - Example
-
Set a breakpoint on an action (SamePage1).
-
In the Debugging panel, click the control (button1) on which the SamePage1 action is set.
The status of the SamePage1 action is updated to pause indicating that a breakpoint is set.
-
To skip this action, click Skip in the stack trace panel.
The status is updated from pause to skipped indicating that the action is not executed and pauses at the next action if applicable.
Using Conditions while debugging
You can determine the path that was taken when using conditions in a debug mode. When you configure your form to have a Begin condition and an Else condition, these are displayed in the stack trace so that you can determine where the logic was executed.
Note You can have a Begin condition within a Begin condition for nested logic.When you click on the Begin condition, you can view the outcome whether it is true or false. For example, in the following scenario, the outcome of BeginCondition1 is false and the outcome of BeginCondition2 is true.

-
View action inputs/outputs
When you reach a breakpoint, you can expand any server side action, such as .Net action and view and update the values of controls, form and global variables and continue execution.
You can expand a Table control to see all rows and columns.
A Redirect action does not redirect but when executed displays a message stating where it would have redirected to.
To update the value (for example, to update the value of a form variable), perform the following steps.
- Click the Form variables tab.
- Select the variable and click Edit.
-
Change the value as needed, and click
OK.
Note You can update global variables and form controls in a similar manner. However, you cannot update array form variables and advanced form controls.