Example - Chart control
This example illustrates configuring the Chart control to display pie, bar and column charts.
- Add three Chart controls to a form: Chart 1, Chart 2 and Chart 3.
-
Configure the chart controls as given in the table.
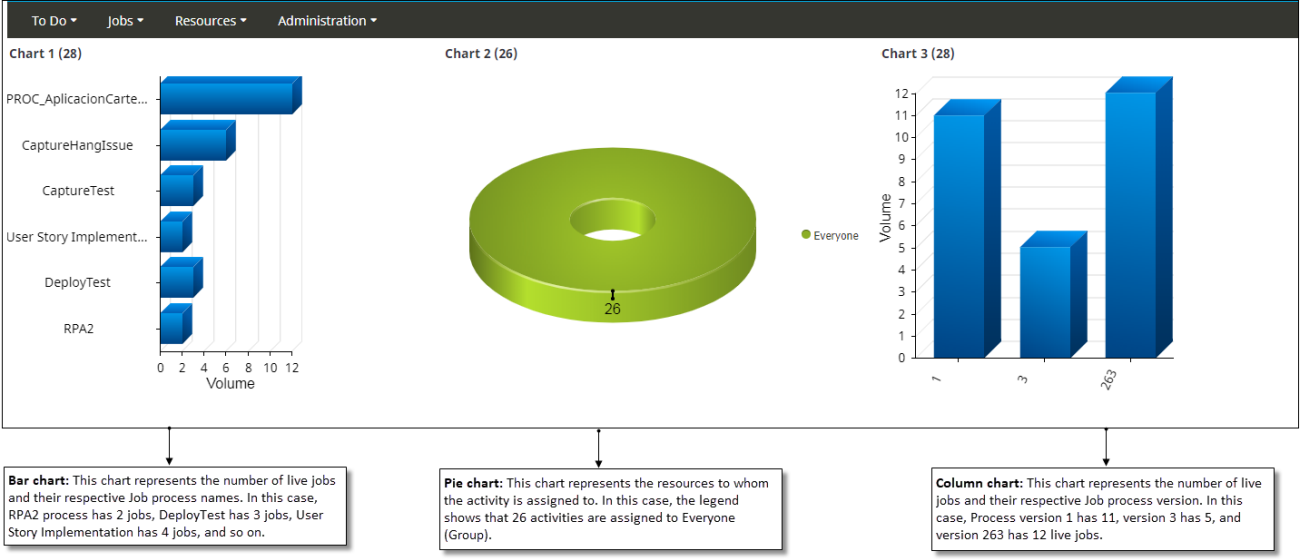
Properties Chart 1 Chart 2 Chart 3 Query Live jobs (Job query) All Work Due Today (Workqueue query) Live jobs (Job query) Group by Job process name Activity assigned to Job process version Number of segments 10 10 10 Show chart in 3D Refresh interval 0 seconds 0 seconds 0 seconds Chart type Bar Pie Column Padding 10px, 0px, 150px, 10px 10px, 10px, 10 px, 10px 10px, 0px, 150px, 10px Inner padding 22px Legend position Right Show legend Show pie with donut Show label Label length 20px 20px - Save and release the form.
-
Open the sample form at runtime.
The Bar, Pie and Column charts appear as shown below.